29
/fr/
fr
AIzaSyAYiBZKx7MnpbEhh9jyipgxe19OcubqV5w
April 1, 2024
36919
IBRD only
IBD
false
2
1
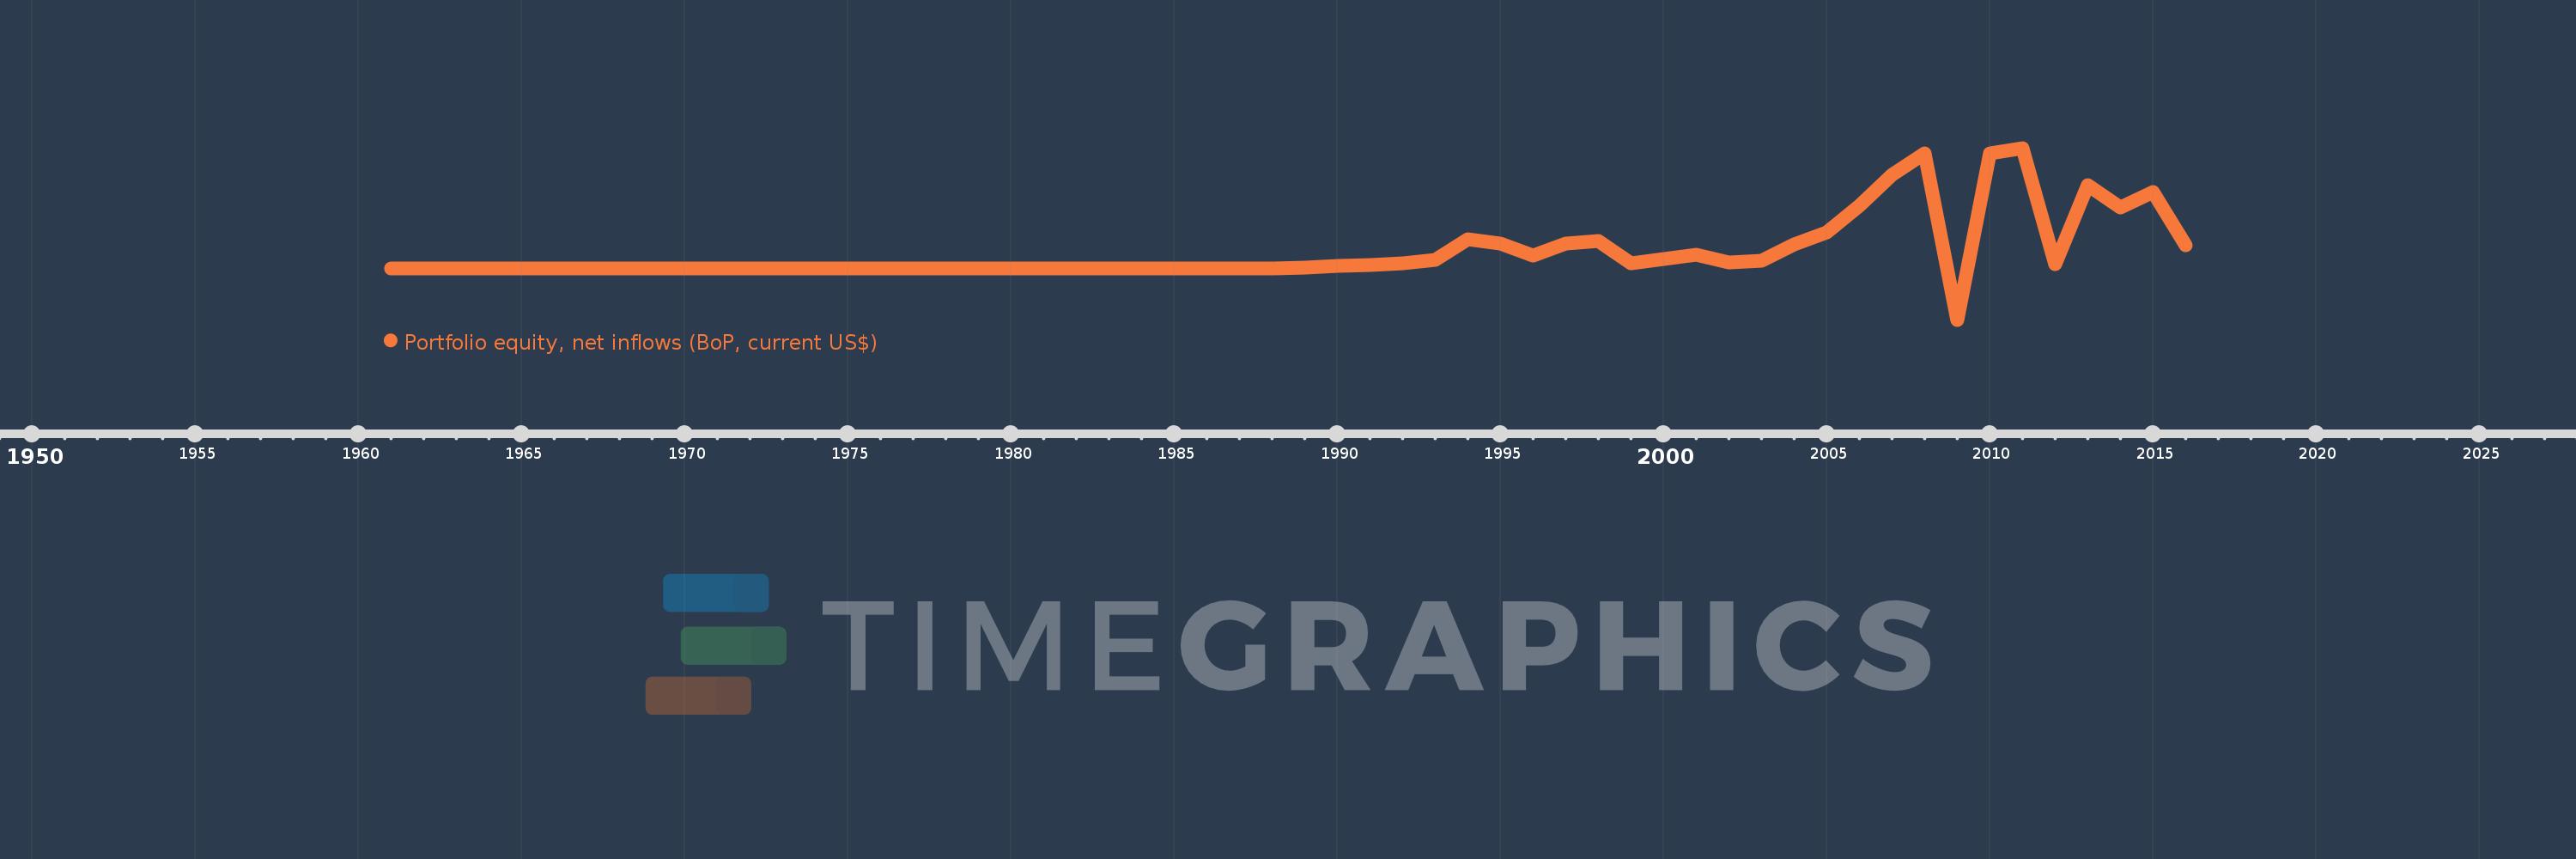
Portfolio equity, net inflows (BoP, current US$)
2016,2015,2014,2013,2012,2011,2010,2009,2008,2007,2006,2005,2004,2003,2002,2001,2000,1999,1998,1997,1996,1995,1994,1993,1992,1991,1990,1989,1988,1987,1986,1985,1984,1983,1982,1981,1980,1979,1978,1977,1976,1975,1974,1973,1972,1971,1970,1969,1968,1967,1966,1965,1964,1963,1962,1961
Cette statistique dans les autres pays:
AfghanistanAlbaniaAlgeriaAngolaAntigua and BarbudaArab WorldArgentinaArmeniaArubaAustraliaAustriaAzerbaijanBahamas, TheBahrainBangladeshBarbadosBelarusBelgiumBelizeBeninBermudaBhutanBoliviaBosnia and HerzegovinaBotswanaBrazilBulgariaBurkina FasoBurundiCabo VerdeCambodiaCameroonCanadaCaribbean small statesCentral African RepublicCentral Europe and the BalticsChadChileChinaColombiaComorosCongo, Dem. Rep.Congo, Rep.Costa RicaCote d'IvoireCroatiaCuracaoCyprusCzech RepublicDenmarkDjiboutiDominicaDominican RepublicEarly-demographic dividendEast Asia & PacificEast Asia & Pacific (excluding high income)East Asia & Pacific (IDA & IBRD countries)EcuadorEgypt, Arab Rep.El SalvadorEquatorial GuineaEstoniaEthiopiaEuro areaEurope & Central AsiaEurope & Central Asia (excluding high income)Europe & Central Asia (IDA & IBRD countries)European UnionFijiFinlandFragile and conflict affected situationsFranceFrench PolynesiaGabonGambia, TheGeorgiaGermanyGhanaGreeceGrenadaGuatemalaGuineaGuinea-BissauGuyanaHaitiHeavily indebted poor countries (HIPC)High incomeHondurasHong Kong SAR, ChinaHungaryIBRD onlyIcelandIDA & IBRD totalIDA blendIDA onlyIDA totalIndiaIndonesiaIran, Islamic Rep.IraqIrelandIsraelItalyJamaicaJapanJordanKazakhstanKenyaKiribatiKorea, Rep.KosovoKuwaitKyrgyz RepublicLao PDRLate-demographic dividendLatin America & Caribbean Latin America & Caribbean (excluding high income)Latin America & the Caribbean (IDA & IBRD countries)LatviaLeast developed countries: UN classificationLebanonLesothoLiberiaLibyaLithuaniaLow & middle incomeLow incomeLower middle incomeLuxembourgMacao SAR, ChinaMacedonia, FYRMadagascarMalawiMalaysiaMaldivesMaliMaltaMarshall IslandsMauritaniaMauritiusMexicoMiddle East & North AfricaMiddle East & North Africa (excluding high income)Middle East & North Africa (IDA & IBRD countries)Middle incomeMoldovaMongoliaMontenegroMoroccoMozambiqueMyanmarNamibiaNepalNetherlandsNew CaledoniaNew ZealandNicaraguaNigerNigeriaNorth AmericaNorwayOECD membersOmanOther small statesPacific island small statesPakistanPanamaPapua New GuineaParaguayPeruPhilippinesPolandPortugalPost-demographic dividendPre-demographic dividendQatarRomaniaRussian FederationRwandaSamoaSao Tome and PrincipeSaudi ArabiaSenegalSerbiaSeychellesSierra LeoneSingaporeSlovak RepublicSloveniaSmall statesSolomon IslandsSomaliaSouth AfricaSouth AsiaSouth Asia (IDA & IBRD)SpainSri LankaSt. Kitts and NevisSt. LuciaSt. Vincent and the GrenadinesSub-Saharan Africa Sub-Saharan Africa (excluding high income)Sub-Saharan Africa (IDA & IBRD countries)SudanSurinameSwazilandSwedenSwitzerlandSyrian Arab RepublicTajikistanTanzaniaThailandTimor-LesteTogoTongaTrinidad and TobagoTunisiaTurkeyUgandaUkraineUnited KingdomUnited StatesUpper middle incomeUruguayVanuatuVenezuela, RBVietnamWest Bank and GazaWorldYemen, Rep.ZambiaZimbabwe La ligne de temps
Cette échelle de temps montre un graphique de 1961 année à 2016 année IBRD only. Les données jusqu'à 1960 année ne sont pas présentés. Quantité d'observations actuelles selon dates: 56.
Source (désignation):
Les indicateurs du développement mondiale
Source (organisation):
International Monetary Fund, Balance of Payments database, and World Bank, International Debt Statistics.
Catégories:
Economy & Growth, Financial Sector, External Debt
Dernière mise à jour
23 avr. 2017
Les indicateurs de changement de valeurs selon les années
Minimum:
-55.901 mds
1 janv. 2009
Maximum:
130.662 mds
1 janv. 2011
Pour la date d''observation
Valeur
Changement absolu
Le changement par rapport à la valeur précédente
1 janv. 1976
1.325 mln.
+1.325 mln.
%
1 janv. 1977
2.251 mln.
+925.718 milles
69.87%
1 janv. 1978
-3.251 mln.
-5.502 mln.
-244.45%
1 janv. 1979
15.161 mln.
+18.412 mln.
-566.34%
1 janv. 1980
-1.962 mln.
-17.123 mln.
-112.94%
1 janv. 1981
56.495 mln.
+58.457 mln.
-2.98 milles%
1 janv. 1982
108.181 mln.
+51.686 mln.
91.49%
1 janv. 1983
101.217 mln.
-6.964 mln.
-6.44%
1 janv. 1984
77.319 mln.
-23.899 mln.
-23.61%
1 janv. 1985
134.172 mln.
+56.853 mln.
73.53%
1 janv. 1986
-89.64 mln.
-223.812 mln.
-166.81%
1 janv. 1987
-459.676 mln.
-370.036 mln.
412.8%
1 janv. 1988
-44.584 mln.
+415.092 mln.
-90.3%
1 janv. 1989
381.491 mln.
+426.075 mln.
-955.68%
1 janv. 1990
2.433 mds
+2.052 mds
537.87%
1 janv. 1991
3.384 mds
+950.185 mln.
39.05%
1 janv. 1992
5.707 mds
+2.324 mds
68.68%
1 janv. 1993
9.157 mds
+3.45 mds
60.44%
1 janv. 1994
31.407 mds
+22.25 mds
242.99%
1 janv. 1995
26.79 mds
-4.617 mds
-14.7%
1 janv. 1996
14.054 mds
-12.736 mds
-47.54%
1 janv. 1997
26.807 mds
+12.752 mds
90.74%
1 janv. 1998
29.482 mds
+2.676 mds
9.98%
1 janv. 1999
5.02 mds
-24.462 mds
-82.97%
1 janv. 2000
10.003 mds
+4.983 mds
99.26%
1 janv. 2001
14.273 mds
+4.27 mds
42.69%
1 janv. 2002
6.568 mds
-7.705 mds
-53.99%
1 janv. 2003
7.741 mds
+1.173 mds
17.87%
1 janv. 2004
25.604 mds
+17.863 mds
230.77%
1 janv. 2005
38.779 mds
+13.175 mds
51.46%
1 janv. 2006
67.853 mds
+29.074 mds
74.97%
1 janv. 2007
101.744 mds
+33.891 mds
49.95%
1 janv. 2008
124.966 mds
+23.222 mds
22.82%
1 janv. 2009
-55.901 mds
-180.867 mds
-144.73%
1 janv. 2010
124.719 mds
+180.62 mds
-323.11%
1 janv. 2011
130.662 mds
+5.943 mds
4.76%
1 janv. 2012
3.999 mds
-126.663 mds
-96.94%
1 janv. 2013
90.399 mds
+86.4 mds
2.16 milles%
1 janv. 2014
66.076 mds
-24.323 mds
-26.91%
1 janv. 2015
82.794 mds
+16.718 mds
25.3%
1 janv. 2016
25.302 mds
-57.491 mds
-69.44%
Classement des pays selon les statistiques actuelles par années


Commentaires: