29
/fr/
fr
AIzaSyAYiBZKx7MnpbEhh9jyipgxe19OcubqV5w
April 1, 2024
44586
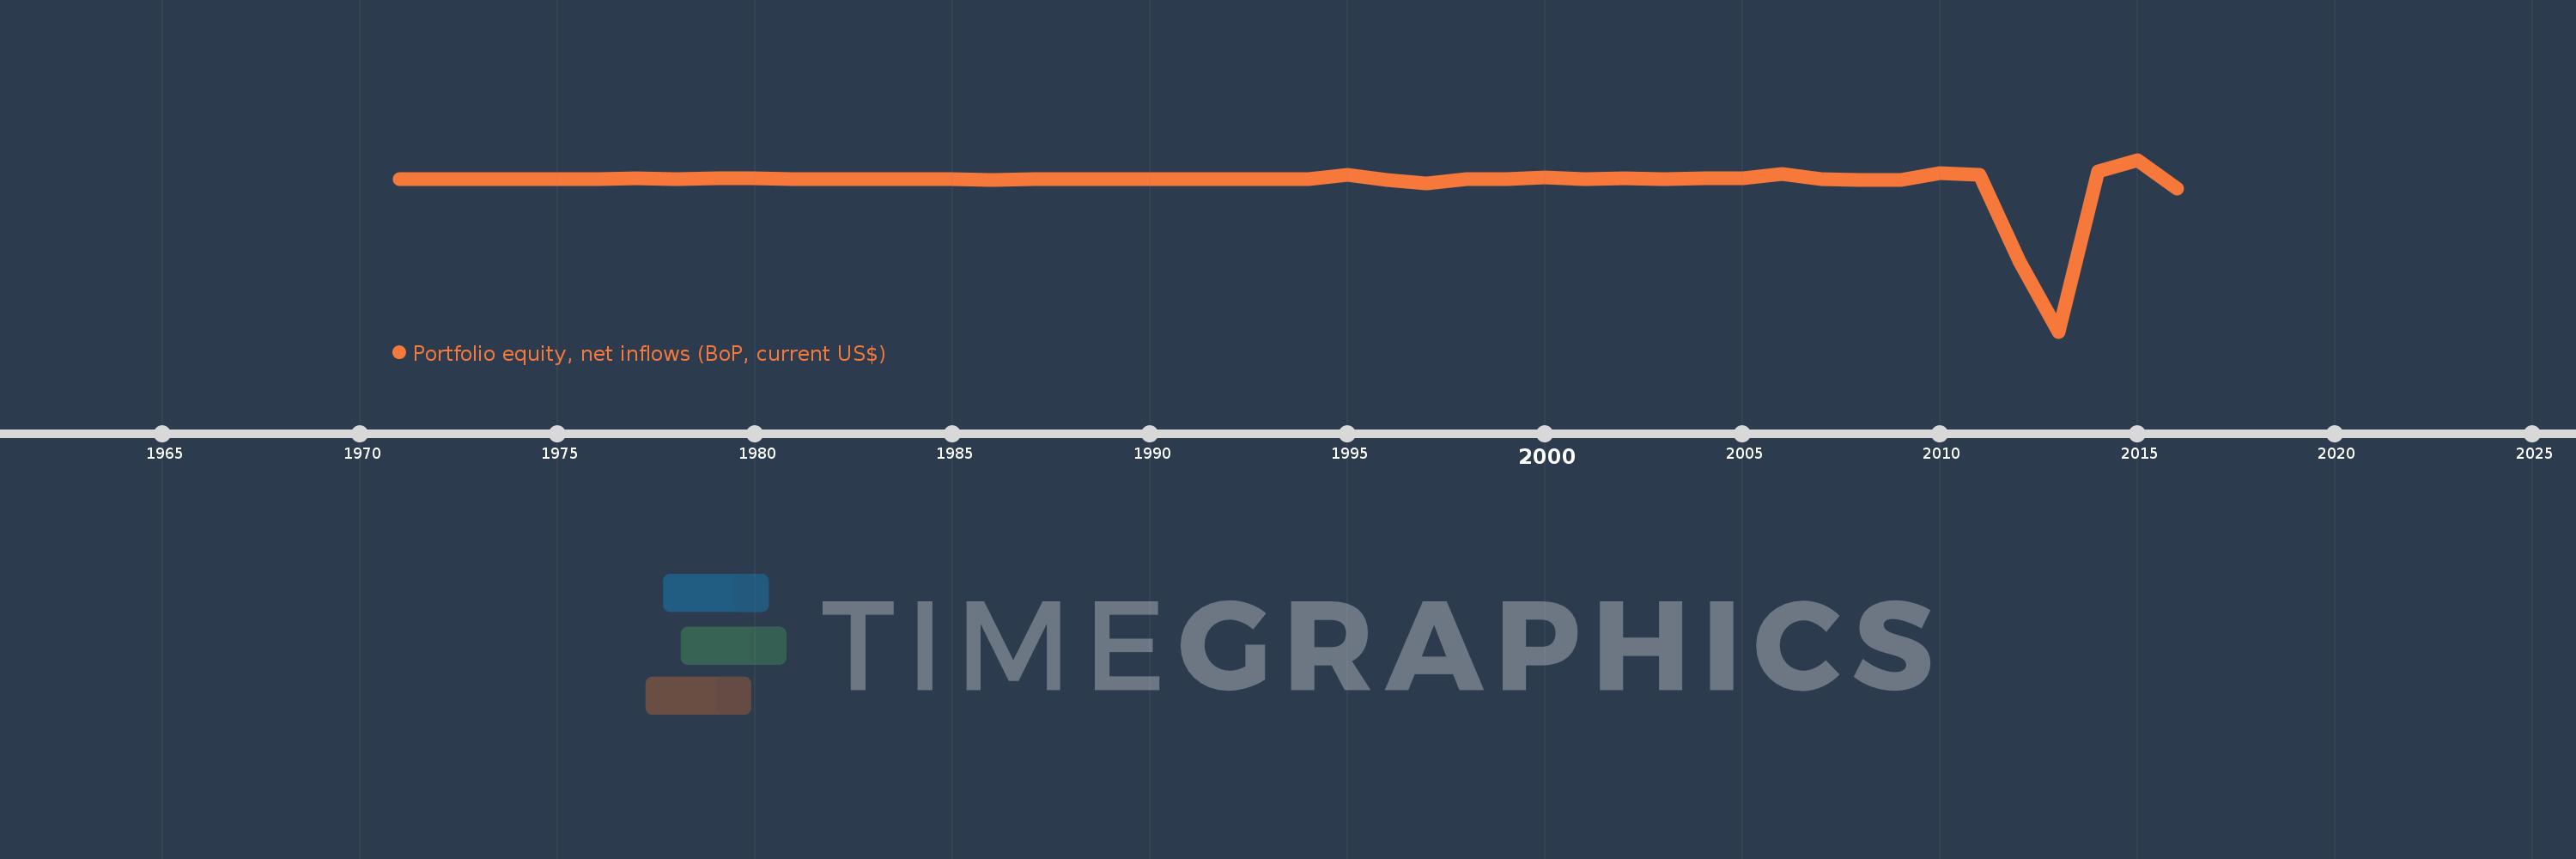
Least developed countries: UN classification
LDC
false
2
1
Portfolio equity, net inflows (BoP, current US$)
2016,2015,2014,2013,2012,2011,2010,2009,2008,2007,2006,2005,2004,2003,2002,2001,2000,1999,1998,1997,1996,1995,1994,1993,1992,1991,1990,1989,1988,1987,1986,1985,1984,1983,1982,1981,1980,1979,1978,1977,1976,1975,1974,1973,1972,1971
Cette statistique dans les autres pays:
AfghanistanAlbaniaAlgeriaAngolaAntigua and BarbudaArab WorldArgentinaArmeniaArubaAustraliaAustriaAzerbaijanBahamas, TheBahrainBangladeshBarbadosBelarusBelgiumBelizeBeninBermudaBhutanBoliviaBosnia and HerzegovinaBotswanaBrazilBulgariaBurkina FasoBurundiCabo VerdeCambodiaCameroonCanadaCaribbean small statesCentral African RepublicCentral Europe and the BalticsChadChileChinaColombiaComorosCongo, Dem. Rep.Congo, Rep.Costa RicaCote d'IvoireCroatiaCuracaoCyprusCzech RepublicDenmarkDjiboutiDominicaDominican RepublicEarly-demographic dividendEast Asia & PacificEast Asia & Pacific (excluding high income)East Asia & Pacific (IDA & IBRD countries)EcuadorEgypt, Arab Rep.El SalvadorEquatorial GuineaEstoniaEthiopiaEuro areaEurope & Central AsiaEurope & Central Asia (excluding high income)Europe & Central Asia (IDA & IBRD countries)European UnionFijiFinlandFragile and conflict affected situationsFranceFrench PolynesiaGabonGambia, TheGeorgiaGermanyGhanaGreeceGrenadaGuatemalaGuineaGuinea-BissauGuyanaHaitiHeavily indebted poor countries (HIPC)High incomeHondurasHong Kong SAR, ChinaHungaryIBRD onlyIcelandIDA & IBRD totalIDA blendIDA onlyIDA totalIndiaIndonesiaIran, Islamic Rep.IraqIrelandIsraelItalyJamaicaJapanJordanKazakhstanKenyaKiribatiKorea, Rep.KosovoKuwaitKyrgyz RepublicLao PDRLate-demographic dividendLatin America & Caribbean Latin America & Caribbean (excluding high income)Latin America & the Caribbean (IDA & IBRD countries)LatviaLeast developed countries: UN classificationLebanonLesothoLiberiaLibyaLithuaniaLow & middle incomeLow incomeLower middle incomeLuxembourgMacao SAR, ChinaMacedonia, FYRMadagascarMalawiMalaysiaMaldivesMaliMaltaMarshall IslandsMauritaniaMauritiusMexicoMiddle East & North AfricaMiddle East & North Africa (excluding high income)Middle East & North Africa (IDA & IBRD countries)Middle incomeMoldovaMongoliaMontenegroMoroccoMozambiqueMyanmarNamibiaNepalNetherlandsNew CaledoniaNew ZealandNicaraguaNigerNigeriaNorth AmericaNorwayOECD membersOmanOther small statesPacific island small statesPakistanPanamaPapua New GuineaParaguayPeruPhilippinesPolandPortugalPost-demographic dividendPre-demographic dividendQatarRomaniaRussian FederationRwandaSamoaSao Tome and PrincipeSaudi ArabiaSenegalSerbiaSeychellesSierra LeoneSingaporeSlovak RepublicSloveniaSmall statesSolomon IslandsSomaliaSouth AfricaSouth AsiaSouth Asia (IDA & IBRD)SpainSri LankaSt. Kitts and NevisSt. LuciaSt. Vincent and the GrenadinesSub-Saharan Africa Sub-Saharan Africa (excluding high income)Sub-Saharan Africa (IDA & IBRD countries)SudanSurinameSwazilandSwedenSwitzerlandSyrian Arab RepublicTajikistanTanzaniaThailandTimor-LesteTogoTongaTrinidad and TobagoTunisiaTurkeyUgandaUkraineUnited KingdomUnited StatesUpper middle incomeUruguayVanuatuVenezuela, RBVietnamWest Bank and GazaWorldYemen, Rep.ZambiaZimbabwe La ligne de temps
Cette échelle de temps montre un graphique de 1971 année à 2016 année Least developed countries: UN classification. Les données jusqu'à 1970 année ne sont pas présentés. Quantité d'observations actuelles selon dates: 46.
Source (désignation):
Les indicateurs du développement mondiale
Source (organisation):
International Monetary Fund, Balance of Payments database, and World Bank, International Debt Statistics.
Catégories:
Economy & Growth, Financial Sector, External Debt
Dernière mise à jour
23 avr. 2017
Les indicateurs de changement de valeurs selon les années
Minimum:
-3.539 mds
1 janv. 2013
Maximum:
453.898 mln.
1 janv. 2015
Pour la date d''observation
Valeur
Changement absolu
Le changement par rapport à la valeur précédente
1 janv. 1975
3.756 mln.
+3.756 mln.
%
1 janv. 1976
3.238 mln.
-517.384 milles
-13.78%
1 janv. 1977
33.463 mln.
+30.225 mln.
933.36%
1 janv. 1978
3.83 mln.
-29.633 mln.
-88.55%
1 janv. 1979
24.407 mln.
+20.576 mln.
537.22%
1 janv. 1980
22.309 mln.
-2.097 mln.
-8.59%
1 janv. 1981
3.967 mln.
-18.343 mln.
-82.22%
1 janv. 1982
3.178 mln.
-788.327 milles
-19.87%
1 janv. 1983
4.351 mln.
+1.172 mln.
36.88%
1 janv. 1984
1.68 mln.
-2.67 mln.
-61.38%
1 janv. 1985
3.94 mln.
+2.26 mln.
134.47%
1 janv. 1986
-6.341 mln.
-10.281 mln.
-260.95%
1 janv. 1987
2.722 mln.
+9.063 mln.
-142.92%
1 janv. 1988
5.627 mln.
+2.905 mln.
106.72%
1 janv. 1989
2.989 mln.
-2.638 mln.
-46.88%
1 janv. 1990
4.848 mln.
+1.859 mln.
62.2%
1 janv. 1991
6.821 mln.
+1.973 mln.
40.69%
1 janv. 1992
5.767 mln.
-1.054 mln.
-15.45%
1 janv. 1993
10.799 mln.
+5.032 mln.
87.26%
1 janv. 1994
14.439 mln.
+3.64 mln.
33.71%
1 janv. 1995
106.312 mln.
+91.873 mln.
636.27%
1 janv. 1996
-10.808 mln.
-117.12 mln.
-110.17%
1 janv. 1997
-95.586 mln.
-84.778 mln.
784.4%
1 janv. 1998
13.131 mln.
+108.718 mln.
-113.74%
1 janv. 1999
11.835 mln.
-1.296 mln.
-9.87%
1 janv. 2000
48.583 mln.
+36.748 mln.
310.5%
1 janv. 2001
9.024 mln.
-39.558 mln.
-81.42%
1 janv. 2002
22.954 mln.
+13.929 mln.
154.35%
1 janv. 2003
11.949 mln.
-11.005 mln.
-47.94%
1 janv. 2004
23.38 mln.
+11.431 mln.
95.67%
1 janv. 2005
22.382 mln.
-998.133 milles
-4.27%
1 janv. 2006
119.786 mln.
+97.404 mln.
435.19%
1 janv. 2007
3.735 mln.
-116.051 mln.
-96.88%
1 janv. 2008
-5.701 mln.
-9.437 mln.
-252.64%
1 janv. 2009
-16.513 mln.
-10.812 mln.
189.64%
1 janv. 2010
140.794 mln.
+157.307 mln.
-952.6%
1 janv. 2011
107.927 mln.
-32.867 mln.
-23.34%
1 janv. 2012
-1.889 mds
-1.997 mds
-1.85 milles%
1 janv. 2013
-3.539 mds
-1.649 mds
87.31%
1 janv. 2014
184.017 mln.
+3.723 mds
-105.2%
1 janv. 2015
453.898 mln.
+269.881 mln.
146.66%
1 janv. 2016
-205.652 mln.
-659.55 mln.
-145.31%
Classement des pays selon les statistiques actuelles par années


Commentaires: