29
/fr/
fr
AIzaSyAYiBZKx7MnpbEhh9jyipgxe19OcubqV5w
April 1, 2024
73345
Australia
AUS
true
2
1
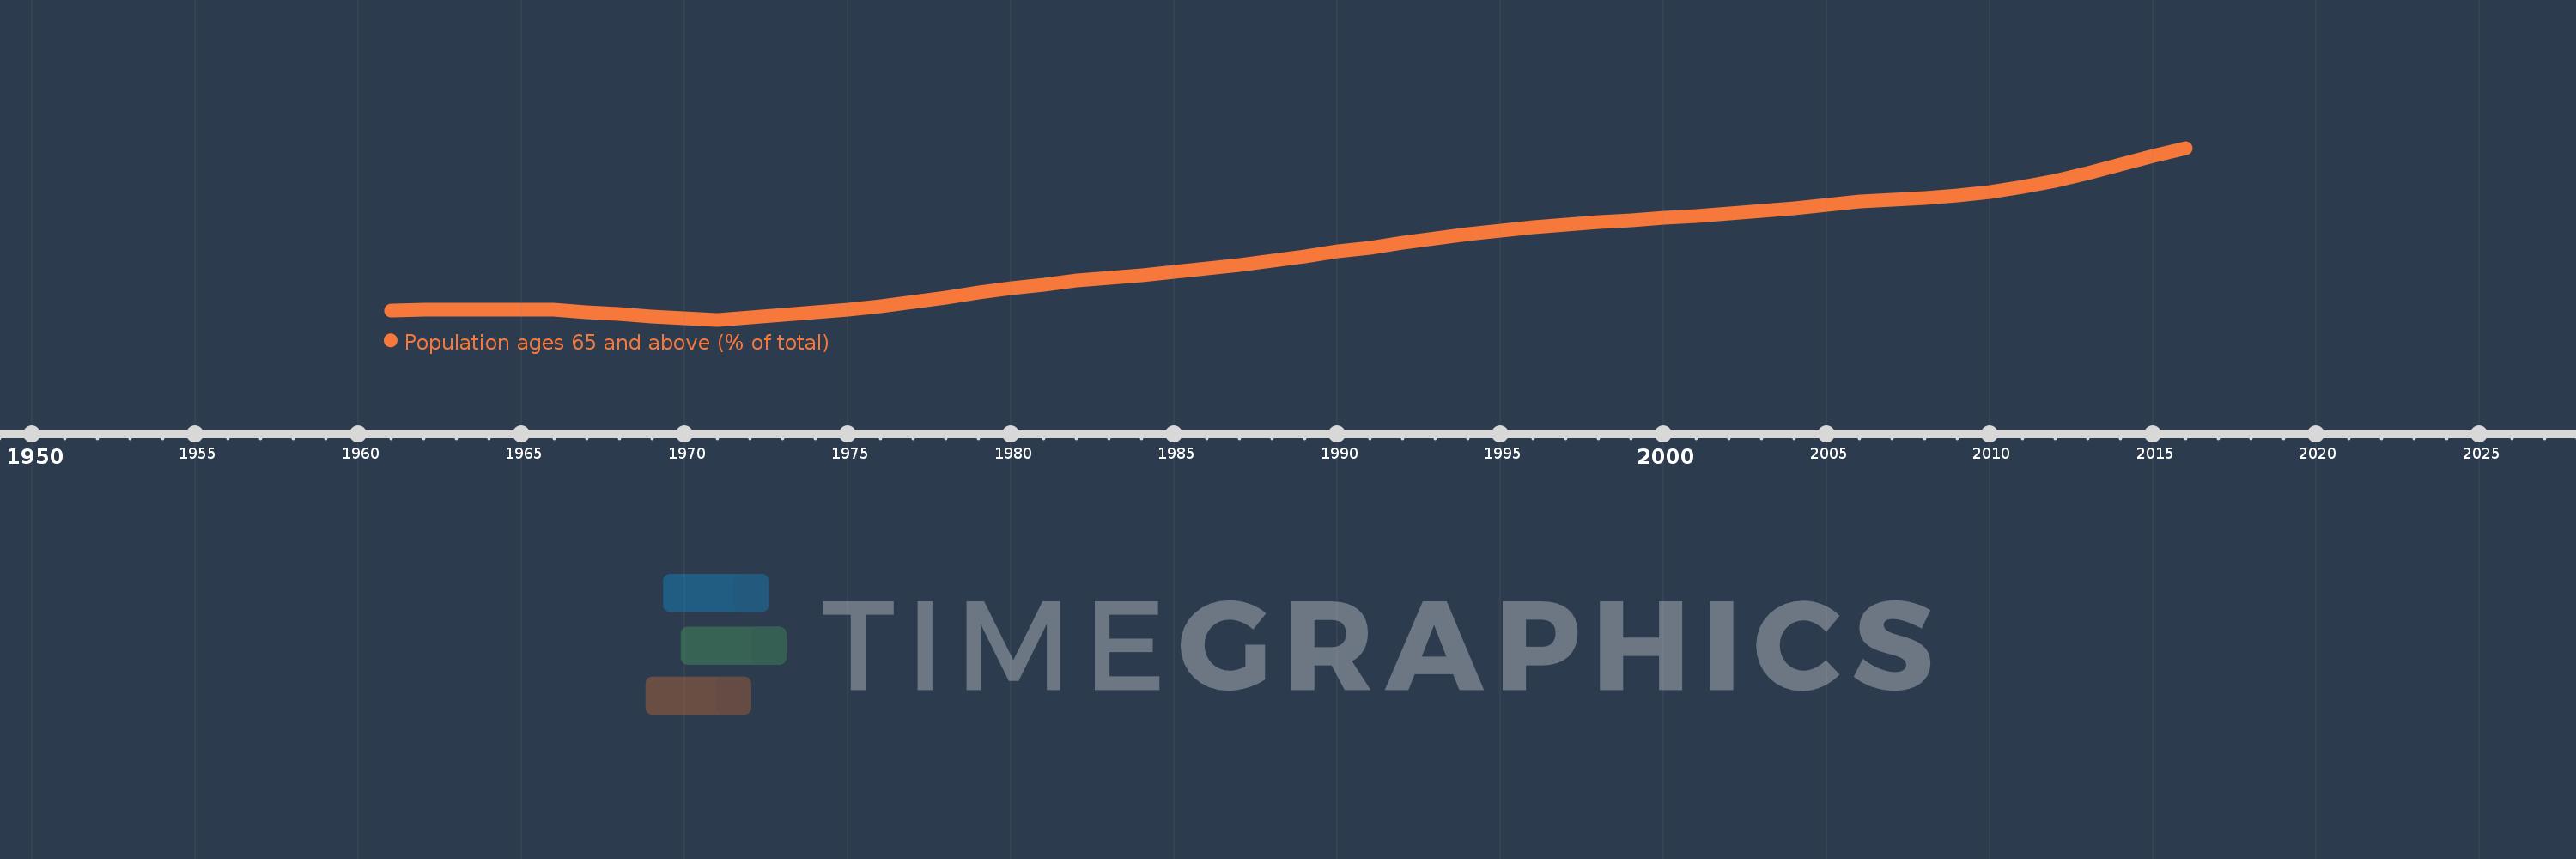
Population ages 65 and above (% of total)
2016,2015,2014,2013,2012,2011,2010,2009,2008,2007,2006,2005,2004,2003,2002,2001,2000,1999,1998,1997,1996,1995,1994,1993,1992,1991,1990,1989,1988,1987,1986,1985,1984,1983,1982,1981,1980,1979,1978,1977,1976,1975,1974,1973,1972,1971,1970,1969,1968,1967,1966,1965,1964,1963,1962,1961
Cette statistique dans les autres pays:
AfghanistanAlbaniaAlgeriaAngolaAntigua and BarbudaArab WorldArgentinaArmeniaArubaAustraliaAustriaAzerbaijanBahamas, TheBahrainBangladeshBarbadosBelarusBelgiumBelizeBeninBhutanBoliviaBosnia and HerzegovinaBotswanaBrazilBrunei DarussalamBulgariaBurkina FasoBurundiCabo VerdeCambodiaCameroonCanadaCaribbean small statesCentral African RepublicCentral Europe and the BalticsChadChannel IslandsChileChinaColombiaComorosCongo, Dem. Rep.Congo, Rep.Costa RicaCote d'IvoireCroatiaCubaCuracaoCyprusCzech RepublicDenmarkDjiboutiDominican RepublicEarly-demographic dividendEast Asia & PacificEast Asia & Pacific (excluding high income)East Asia & Pacific (IDA & IBRD countries)EcuadorEgypt, Arab Rep.El SalvadorEquatorial GuineaEritreaEstoniaEthiopiaEuro areaEurope & Central AsiaEurope & Central Asia (excluding high income)Europe & Central Asia (IDA & IBRD countries)European UnionFijiFinlandFragile and conflict affected situationsFranceFrench PolynesiaGabonGambia, TheGeorgiaGermanyGhanaGreeceGrenadaGuamGuatemalaGuineaGuinea-BissauGuyanaHaitiHeavily indebted poor countries (HIPC)High incomeHondurasHong Kong SAR, ChinaHungaryIBRD onlyIcelandIDA & IBRD totalIDA blendIDA onlyIDA totalIndiaIndonesiaIran, Islamic Rep.IraqIrelandIsraelItalyJamaicaJapanJordanKazakhstanKenyaKiribatiKorea, Dem. People’s Rep.Korea, Rep.KosovoKuwaitKyrgyz RepublicLao PDRLate-demographic dividendLatin America & Caribbean Latin America & Caribbean (excluding high income)Latin America & the Caribbean (IDA & IBRD countries)LatviaLeast developed countries: UN classificationLebanonLesothoLiberiaLibyaLithuaniaLow & middle incomeLow incomeLower middle incomeLuxembourgMacao SAR, ChinaMacedonia, FYRMadagascarMalawiMalaysiaMaldivesMaliMaltaMauritaniaMauritiusMexicoMicronesia, Fed. Sts.Middle East & North AfricaMiddle East & North Africa (excluding high income)Middle East & North Africa (IDA & IBRD countries)Middle incomeMoldovaMongoliaMontenegroMoroccoMozambiqueMyanmarNamibiaNepalNetherlandsNew CaledoniaNew ZealandNicaraguaNigerNigeriaNorth AmericaNorwayOECD membersOmanOther small statesPacific island small statesPakistanPanamaPapua New GuineaParaguayPeruPhilippinesPolandPortugalPost-demographic dividendPre-demographic dividendPuerto RicoQatarRomaniaRussian FederationRwandaSamoaSao Tome and PrincipeSaudi ArabiaSenegalSerbiaSeychellesSierra LeoneSingaporeSlovak RepublicSloveniaSmall statesSolomon IslandsSomaliaSouth AfricaSouth AsiaSouth Asia (IDA & IBRD)South SudanSpainSri LankaSt. LuciaSt. Vincent and the GrenadinesSub-Saharan Africa Sub-Saharan Africa (excluding high income)Sub-Saharan Africa (IDA & IBRD countries)SudanSurinameSwazilandSwedenSwitzerlandSyrian Arab RepublicTajikistanTanzaniaThailandTimor-LesteTogoTongaTrinidad and TobagoTunisiaTurkeyTurkmenistanUgandaUkraineUnited Arab EmiratesUnited KingdomUnited StatesUpper middle incomeUruguayUzbekistanVanuatuVenezuela, RBVietnamVirgin Islands (U.S.)West Bank and GazaWorldYemen, Rep.ZambiaZimbabwe La ligne de temps
Cette échelle de temps montre un graphique de 1961 année à 2016 année Australia. Les données jusqu'à 1960 année ne sont pas présentés. Quantité d'observations actuelles selon dates: 56.
Source (désignation):
Les indicateurs du développement mondiale
Source (organisation):
World Bank staff estimates based on age distributions of United Nations Population Division's World Population Prospects.
Catégories:
Health
Dernière mise à jour
23 avr. 2017
Les indicateurs de changement de valeurs selon les années
Minimum:
8.229
1 janv. 1971
Maximum:
15.045
1 janv. 2016
Pour la date d''observation
Valeur
Changement absolu
Le changement par rapport à la valeur précédente
1 janv. 1961
8.602
+8.602
0.0%
1 janv. 1962
8.621
+0.018
0.21%
1 janv. 1963
8.631
+0.01
0.12%
1 janv. 1964
8.634
+0.003
0.03%
1 janv. 1965
8.627
-0.006
-0.07%
1 janv. 1966
8.612
-0.015
-0.18%
1 janv. 1967
8.53
-0.082
-0.95%
1 janv. 1968
8.444
-0.086
-1.01%
1 janv. 1969
8.359
-0.084
-1.0%
1 janv. 1970
8.286
-0.074
-0.88%
1 janv. 1971
8.229
-0.057
-0.68%
1 janv. 1972
8.329
+0.1
1.21%
1 janv. 1973
8.424
+0.095
1.15%
1 janv. 1974
8.523
+0.099
1.17%
1 janv. 1975
8.636
+0.113
1.33%
1 janv. 1976
8.769
+0.133
1.54%
1 janv. 1977
8.923
+0.154
1.75%
1 janv. 1978
9.105
+0.183
2.05%
1 janv. 1979
9.298
+0.193
2.12%
1 janv. 1980
9.474
+0.175
1.88%
1 janv. 1981
9.617
+0.144
1.51%
1 janv. 1982
9.78
+0.163
1.69%
1 janv. 1983
9.897
+0.117
1.2%
1 janv. 1984
9.994
+0.098
0.99%
1 janv. 1985
10.111
+0.117
1.17%
1 janv. 1986
10.265
+0.154
1.52%
1 janv. 1987
10.4
+0.136
1.32%
1 janv. 1988
10.569
+0.169
1.62%
1 janv. 1989
10.754
+0.185
1.75%
1 janv. 1990
10.933
+0.178
1.66%
1 janv. 1991
11.096
+0.163
1.49%
1 janv. 1992
11.293
+0.198
1.78%
1 janv. 1993
11.473
+0.18
1.59%
1 janv. 1994
11.633
+0.16
1.39%
1 janv. 1995
11.773
+0.14
1.21%
1 janv. 1996
11.896
+0.122
1.04%
1 janv. 1997
12.001
+0.106
0.89%
1 janv. 1998
12.093
+0.092
0.76%
1 janv. 1999
12.176
+0.083
0.68%
1 janv. 2000
12.259
+0.084
0.69%
1 janv. 2001
12.354
+0.095
0.77%
1 janv. 2002
12.442
+0.088
0.71%
1 janv. 2003
12.542
+0.101
0.81%
1 janv. 2004
12.657
+0.115
0.91%
1 janv. 2005
12.782
+0.125
0.99%
1 janv. 2006
12.913
+0.131
1.03%
1 janv. 2007
12.979
+0.066
0.51%
1 janv. 2008
13.053
+0.074
0.57%
1 janv. 2009
13.15
+0.097
0.74%
1 janv. 2010
13.293
+0.143
1.09%
1 janv. 2011
13.496
+0.202
1.52%
1 janv. 2012
13.734
+0.238
1.77%
1 janv. 2013
14.035
+0.301
2.19%
1 janv. 2014
14.378
+0.343
2.45%
1 janv. 2015
14.724
+0.346
2.41%
1 janv. 2016
15.045
+0.321
2.18%
Classement des pays selon les statistiques actuelles par années


Commentaires: