29
/fr/
fr
AIzaSyAYiBZKx7MnpbEhh9jyipgxe19OcubqV5w
April 1, 2024
60196
Sub-Saharan Africa (excluding high income)
SSA
false
2
1
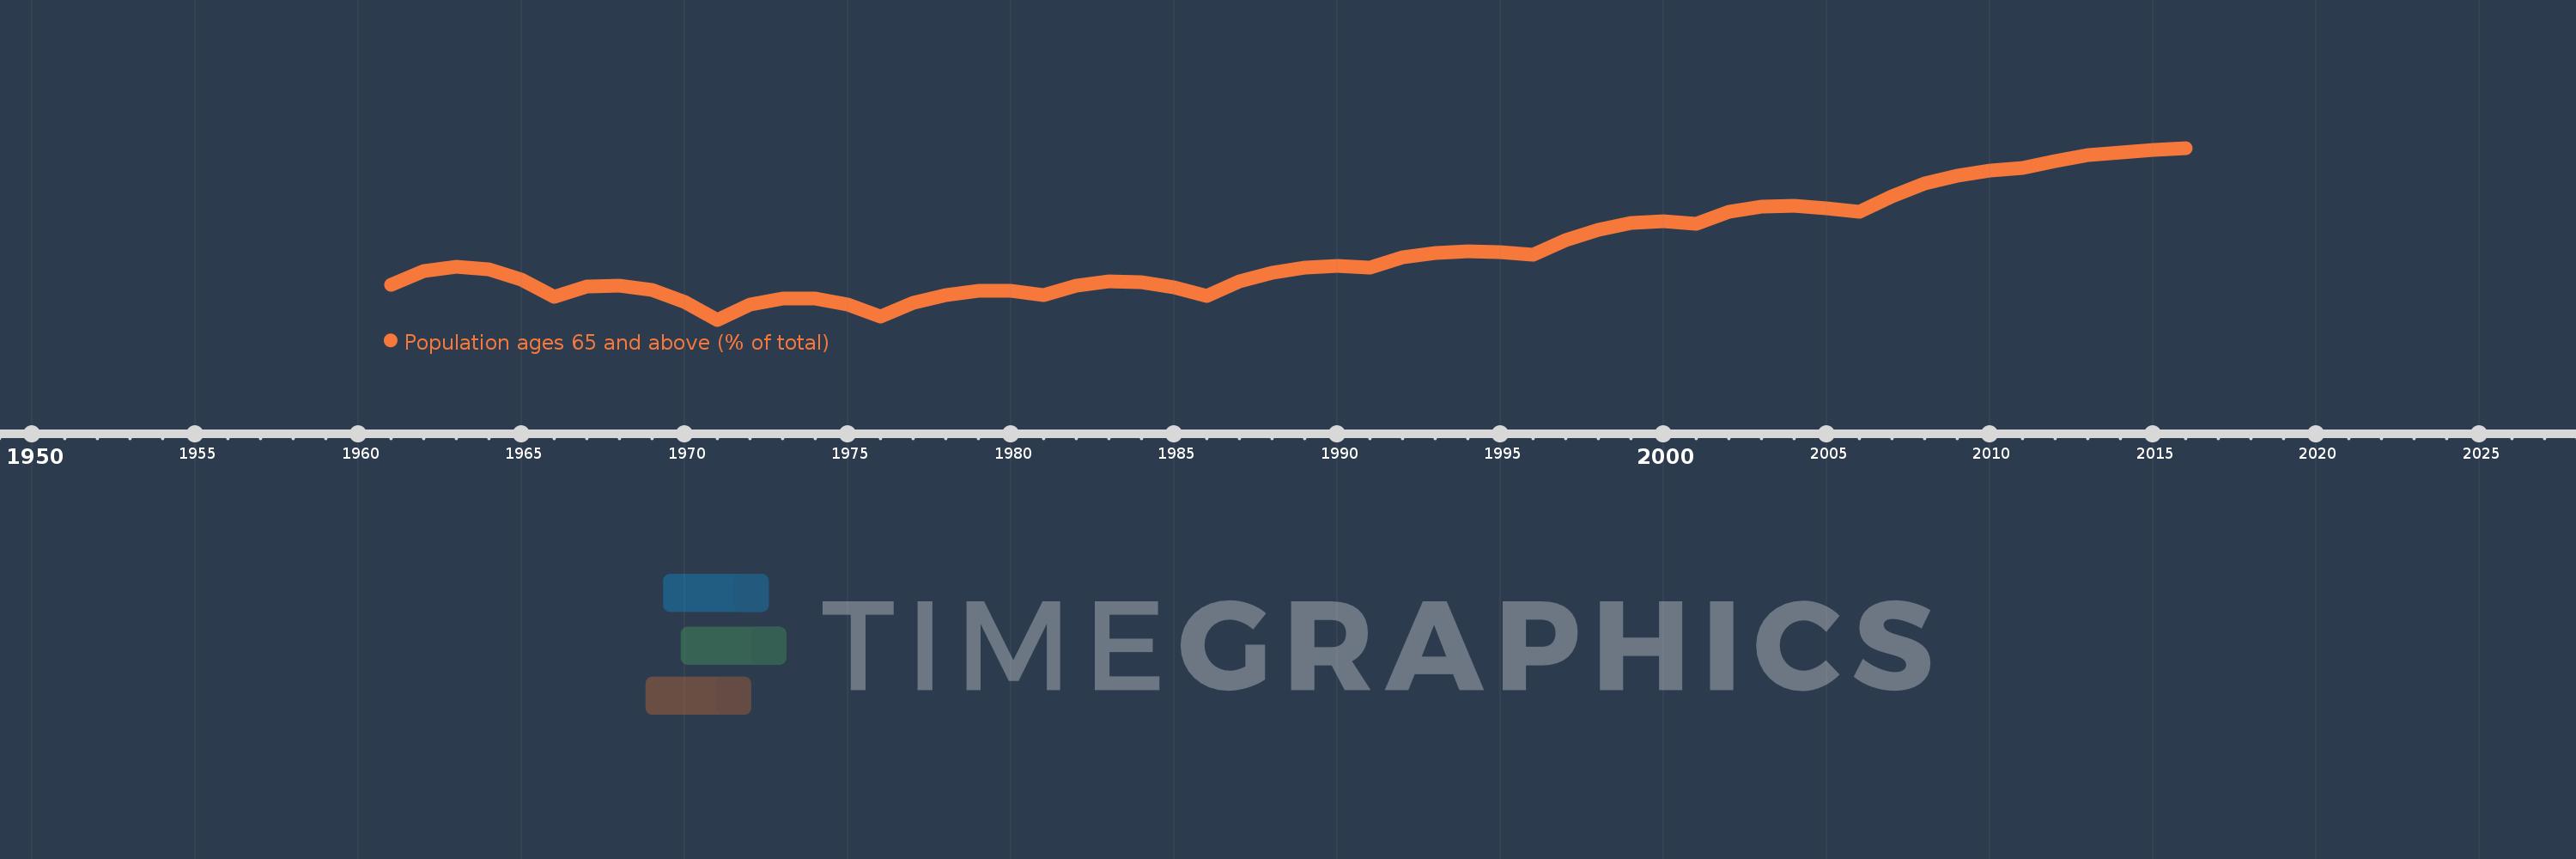
Population ages 65 and above (% of total)
2016,2015,2014,2013,2012,2011,2010,2009,2008,2007,2006,2005,2004,2003,2002,2001,2000,1999,1998,1997,1996,1995,1994,1993,1992,1991,1990,1989,1988,1987,1986,1985,1984,1983,1982,1981,1980,1979,1978,1977,1976,1975,1974,1973,1972,1971,1970,1969,1968,1967,1966,1965,1964,1963,1962,1961
Cette statistique dans les autres pays:
AfghanistanAlbaniaAlgeriaAngolaAntigua and BarbudaArab WorldArgentinaArmeniaArubaAustraliaAustriaAzerbaijanBahamas, TheBahrainBangladeshBarbadosBelarusBelgiumBelizeBeninBhutanBoliviaBosnia and HerzegovinaBotswanaBrazilBrunei DarussalamBulgariaBurkina FasoBurundiCabo VerdeCambodiaCameroonCanadaCaribbean small statesCentral African RepublicCentral Europe and the BalticsChadChannel IslandsChileChinaColombiaComorosCongo, Dem. Rep.Congo, Rep.Costa RicaCote d'IvoireCroatiaCubaCuracaoCyprusCzech RepublicDenmarkDjiboutiDominican RepublicEarly-demographic dividendEast Asia & PacificEast Asia & Pacific (excluding high income)East Asia & Pacific (IDA & IBRD countries)EcuadorEgypt, Arab Rep.El SalvadorEquatorial GuineaEritreaEstoniaEthiopiaEuro areaEurope & Central AsiaEurope & Central Asia (excluding high income)Europe & Central Asia (IDA & IBRD countries)European UnionFijiFinlandFragile and conflict affected situationsFranceFrench PolynesiaGabonGambia, TheGeorgiaGermanyGhanaGreeceGrenadaGuamGuatemalaGuineaGuinea-BissauGuyanaHaitiHeavily indebted poor countries (HIPC)High incomeHondurasHong Kong SAR, ChinaHungaryIBRD onlyIcelandIDA & IBRD totalIDA blendIDA onlyIDA totalIndiaIndonesiaIran, Islamic Rep.IraqIrelandIsraelItalyJamaicaJapanJordanKazakhstanKenyaKiribatiKorea, Dem. People’s Rep.Korea, Rep.KosovoKuwaitKyrgyz RepublicLao PDRLate-demographic dividendLatin America & Caribbean Latin America & Caribbean (excluding high income)Latin America & the Caribbean (IDA & IBRD countries)LatviaLeast developed countries: UN classificationLebanonLesothoLiberiaLibyaLithuaniaLow & middle incomeLow incomeLower middle incomeLuxembourgMacao SAR, ChinaMacedonia, FYRMadagascarMalawiMalaysiaMaldivesMaliMaltaMauritaniaMauritiusMexicoMicronesia, Fed. Sts.Middle East & North AfricaMiddle East & North Africa (excluding high income)Middle East & North Africa (IDA & IBRD countries)Middle incomeMoldovaMongoliaMontenegroMoroccoMozambiqueMyanmarNamibiaNepalNetherlandsNew CaledoniaNew ZealandNicaraguaNigerNigeriaNorth AmericaNorwayOECD membersOmanOther small statesPacific island small statesPakistanPanamaPapua New GuineaParaguayPeruPhilippinesPolandPortugalPost-demographic dividendPre-demographic dividendPuerto RicoQatarRomaniaRussian FederationRwandaSamoaSao Tome and PrincipeSaudi ArabiaSenegalSerbiaSeychellesSierra LeoneSingaporeSlovak RepublicSloveniaSmall statesSolomon IslandsSomaliaSouth AfricaSouth AsiaSouth Asia (IDA & IBRD)South SudanSpainSri LankaSt. LuciaSt. Vincent and the GrenadinesSub-Saharan Africa Sub-Saharan Africa (excluding high income)Sub-Saharan Africa (IDA & IBRD countries)SudanSurinameSwazilandSwedenSwitzerlandSyrian Arab RepublicTajikistanTanzaniaThailandTimor-LesteTogoTongaTrinidad and TobagoTunisiaTurkeyTurkmenistanUgandaUkraineUnited Arab EmiratesUnited KingdomUnited StatesUpper middle incomeUruguayUzbekistanVanuatuVenezuela, RBVietnamVirgin Islands (U.S.)West Bank and GazaWorldYemen, Rep.ZambiaZimbabwe La ligne de temps
Cette échelle de temps montre un graphique de 1961 année à 2016 année Sub-Saharan Africa (excluding high income). Les données jusqu'à 1960 année ne sont pas présentés. Quantité d'observations actuelles selon dates: 56.
Source (désignation):
Les indicateurs du développement mondiale
Source (organisation):
World Bank staff estimates based on age distributions of United Nations Population Division's World Population Prospects.
Catégories:
Health
Dernière mise à jour
23 avr. 2017
Les indicateurs de changement de valeurs selon les années
Minimum:
2.908
1 janv. 1971
Maximum:
3.093
1 janv. 2016
Pour la date d''observation
Valeur
Changement absolu
Le changement par rapport à la valeur précédente
1 janv. 1961
2.946
+2.946
0.0%
1 janv. 1962
2.96
+0.015
0.49%
1 janv. 1963
2.965
+0.005
0.17%
1 janv. 1964
2.962
-0.003
-0.12%
1 janv. 1965
2.951
-0.011
-0.37%
1 janv. 1966
2.933
-0.018
-0.6%
1 janv. 1967
2.944
+0.01
0.35%
1 janv. 1968
2.945
+0.002
0.06%
1 janv. 1969
2.94
-0.006
-0.2%
1 janv. 1970
2.927
-0.013
-0.43%
1 janv. 1971
2.908
-0.018
-0.63%
1 janv. 1972
2.924
+0.015
0.53%
1 janv. 1973
2.931
+0.007
0.25%
1 janv. 1974
2.931
0.0
0.0%
1 janv. 1975
2.924
-0.007
-0.25%
1 janv. 1976
2.911
-0.014
-0.46%
1 janv. 1977
2.926
+0.016
0.54%
1 janv. 1978
2.935
+0.009
0.31%
1 janv. 1979
2.939
+0.004
0.13%
1 janv. 1980
2.939
0.0
-0.01%
1 janv. 1981
2.935
-0.004
-0.13%
1 janv. 1982
2.945
+0.01
0.34%
1 janv. 1983
2.949
+0.004
0.13%
1 janv. 1984
2.948
-0.001
-0.04%
1 janv. 1985
2.943
-0.005
-0.18%
1 janv. 1986
2.934
-0.009
-0.29%
1 janv. 1987
2.949
+0.015
0.51%
1 janv. 1988
2.959
+0.01
0.33%
1 janv. 1989
2.964
+0.005
0.18%
1 janv. 1990
2.966
+0.001
0.05%
1 janv. 1991
2.964
-0.002
-0.05%
1 janv. 1992
2.975
+0.011
0.35%
1 janv. 1993
2.98
+0.006
0.19%
1 janv. 1994
2.982
+0.002
0.06%
1 janv. 1995
2.981
-0.001
-0.03%
1 janv. 1996
2.978
-0.003
-0.09%
1 janv. 1997
2.994
+0.016
0.54%
1 janv. 1998
3.005
+0.011
0.38%
1 janv. 1999
3.012
+0.007
0.23%
1 janv. 2000
3.014
+0.002
0.07%
1 janv. 2001
3.011
-0.003
-0.11%
1 janv. 2002
3.024
+0.013
0.43%
1 janv. 2003
3.03
+0.006
0.19%
1 janv. 2004
3.031
+0.001
0.03%
1 janv. 2005
3.028
-0.002
-0.08%
1 janv. 2006
3.024
-0.005
-0.15%
1 janv. 2007
3.041
+0.018
0.59%
1 janv. 2008
3.055
+0.013
0.43%
1 janv. 2009
3.063
+0.009
0.29%
1 janv. 2010
3.069
+0.005
0.17%
1 janv. 2011
3.071
+0.003
0.09%
1 janv. 2012
3.079
+0.008
0.26%
1 janv. 2013
3.085
+0.005
0.18%
1 janv. 2014
3.088
+0.003
0.11%
1 janv. 2015
3.091
+0.002
0.07%
1 janv. 2016
3.093
+0.002
0.07%
Classement des pays selon les statistiques actuelles par années


Commentaires: