29
/fr/
fr
AIzaSyAYiBZKx7MnpbEhh9jyipgxe19OcubqV5w
April 1, 2024
52163
North America
NAC
false
2
1
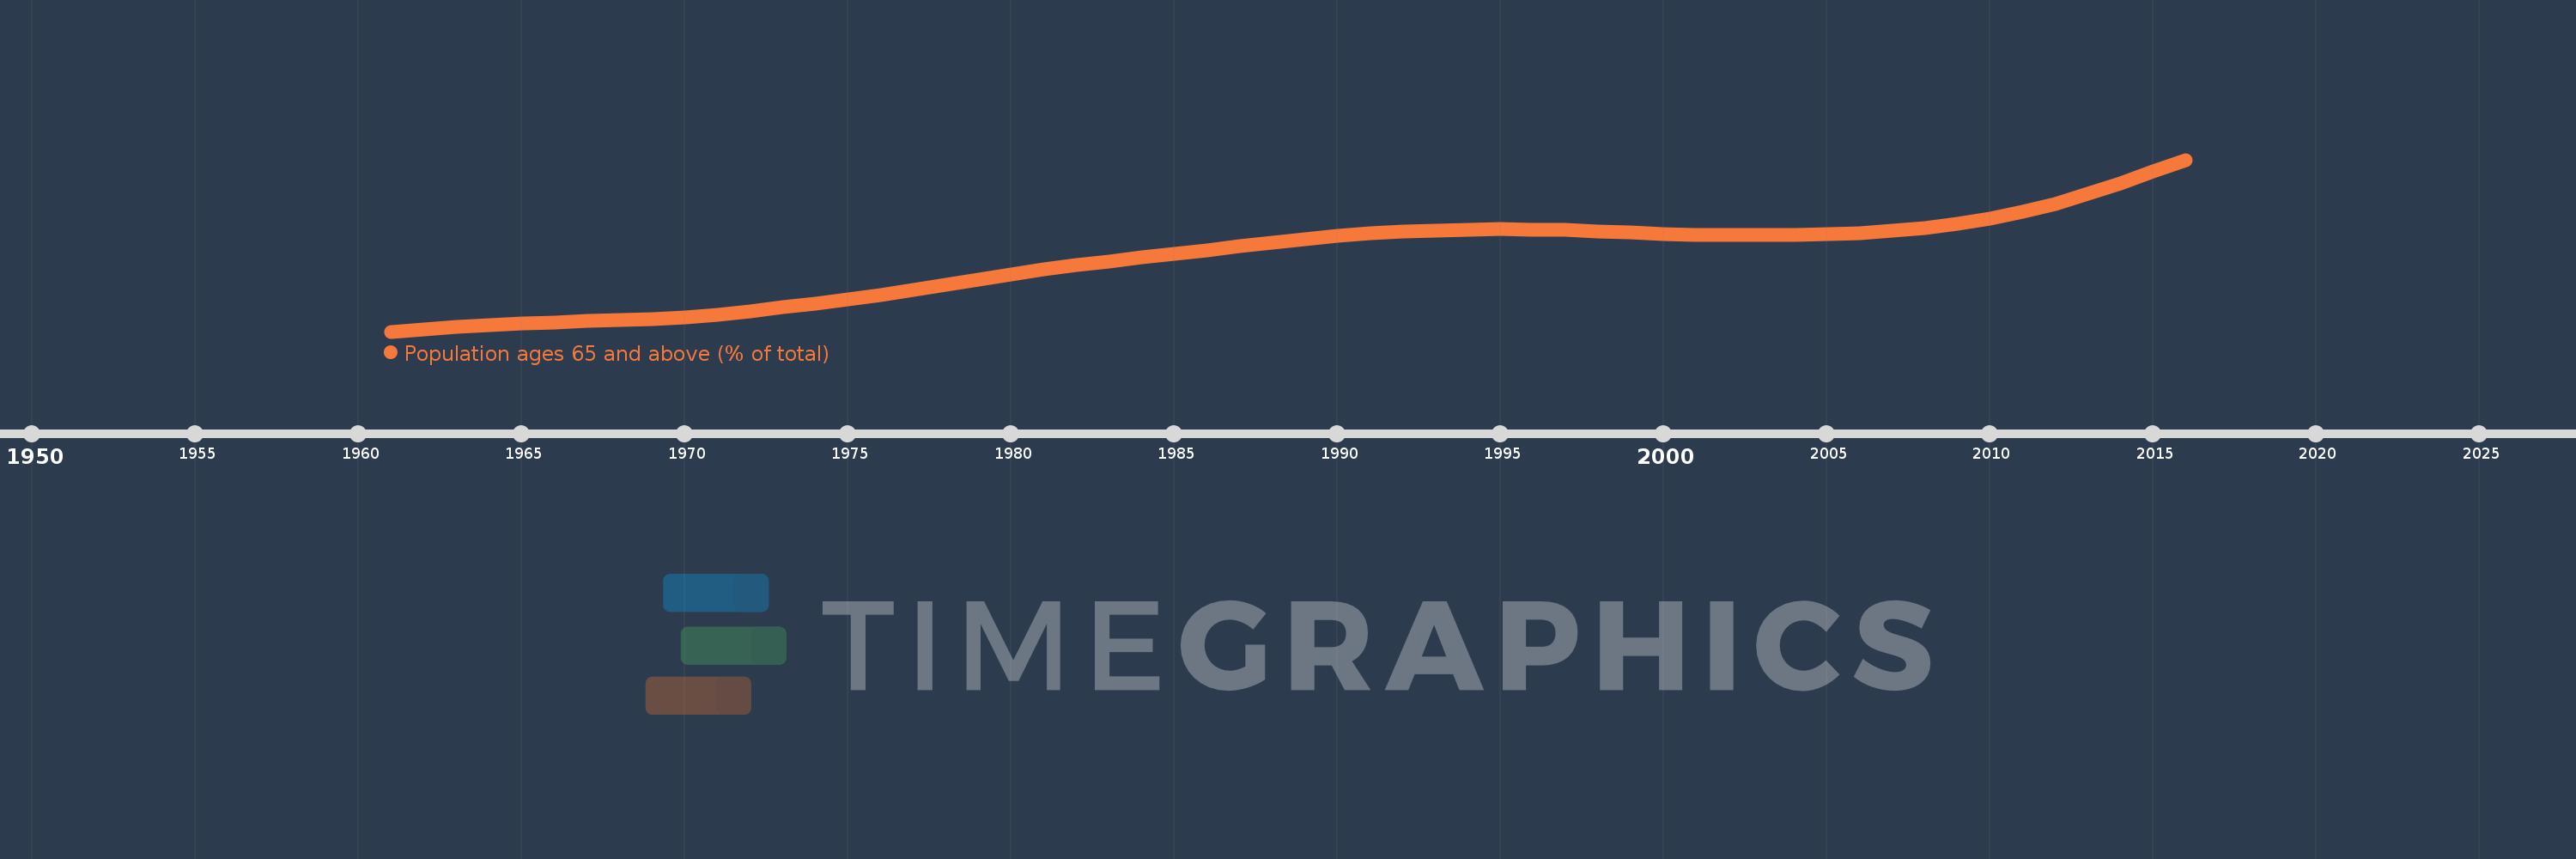
Population ages 65 and above (% of total)
2016,2015,2014,2013,2012,2011,2010,2009,2008,2007,2006,2005,2004,2003,2002,2001,2000,1999,1998,1997,1996,1995,1994,1993,1992,1991,1990,1989,1988,1987,1986,1985,1984,1983,1982,1981,1980,1979,1978,1977,1976,1975,1974,1973,1972,1971,1970,1969,1968,1967,1966,1965,1964,1963,1962,1961
Cette statistique dans les autres pays:
AfghanistanAlbaniaAlgeriaAngolaAntigua and BarbudaArab WorldArgentinaArmeniaArubaAustraliaAustriaAzerbaijanBahamas, TheBahrainBangladeshBarbadosBelarusBelgiumBelizeBeninBhutanBoliviaBosnia and HerzegovinaBotswanaBrazilBrunei DarussalamBulgariaBurkina FasoBurundiCabo VerdeCambodiaCameroonCanadaCaribbean small statesCentral African RepublicCentral Europe and the BalticsChadChannel IslandsChileChinaColombiaComorosCongo, Dem. Rep.Congo, Rep.Costa RicaCote d'IvoireCroatiaCubaCuracaoCyprusCzech RepublicDenmarkDjiboutiDominican RepublicEarly-demographic dividendEast Asia & PacificEast Asia & Pacific (excluding high income)East Asia & Pacific (IDA & IBRD countries)EcuadorEgypt, Arab Rep.El SalvadorEquatorial GuineaEritreaEstoniaEthiopiaEuro areaEurope & Central AsiaEurope & Central Asia (excluding high income)Europe & Central Asia (IDA & IBRD countries)European UnionFijiFinlandFragile and conflict affected situationsFranceFrench PolynesiaGabonGambia, TheGeorgiaGermanyGhanaGreeceGrenadaGuamGuatemalaGuineaGuinea-BissauGuyanaHaitiHeavily indebted poor countries (HIPC)High incomeHondurasHong Kong SAR, ChinaHungaryIBRD onlyIcelandIDA & IBRD totalIDA blendIDA onlyIDA totalIndiaIndonesiaIran, Islamic Rep.IraqIrelandIsraelItalyJamaicaJapanJordanKazakhstanKenyaKiribatiKorea, Dem. People’s Rep.Korea, Rep.KosovoKuwaitKyrgyz RepublicLao PDRLate-demographic dividendLatin America & Caribbean Latin America & Caribbean (excluding high income)Latin America & the Caribbean (IDA & IBRD countries)LatviaLeast developed countries: UN classificationLebanonLesothoLiberiaLibyaLithuaniaLow & middle incomeLow incomeLower middle incomeLuxembourgMacao SAR, ChinaMacedonia, FYRMadagascarMalawiMalaysiaMaldivesMaliMaltaMauritaniaMauritiusMexicoMicronesia, Fed. Sts.Middle East & North AfricaMiddle East & North Africa (excluding high income)Middle East & North Africa (IDA & IBRD countries)Middle incomeMoldovaMongoliaMontenegroMoroccoMozambiqueMyanmarNamibiaNepalNetherlandsNew CaledoniaNew ZealandNicaraguaNigerNigeriaNorth AmericaNorwayOECD membersOmanOther small statesPacific island small statesPakistanPanamaPapua New GuineaParaguayPeruPhilippinesPolandPortugalPost-demographic dividendPre-demographic dividendPuerto RicoQatarRomaniaRussian FederationRwandaSamoaSao Tome and PrincipeSaudi ArabiaSenegalSerbiaSeychellesSierra LeoneSingaporeSlovak RepublicSloveniaSmall statesSolomon IslandsSomaliaSouth AfricaSouth AsiaSouth Asia (IDA & IBRD)South SudanSpainSri LankaSt. LuciaSt. Vincent and the GrenadinesSub-Saharan Africa Sub-Saharan Africa (excluding high income)Sub-Saharan Africa (IDA & IBRD countries)SudanSurinameSwazilandSwedenSwitzerlandSyrian Arab RepublicTajikistanTanzaniaThailandTimor-LesteTogoTongaTrinidad and TobagoTunisiaTurkeyTurkmenistanUgandaUkraineUnited Arab EmiratesUnited KingdomUnited StatesUpper middle incomeUruguayUzbekistanVanuatuVenezuela, RBVietnamVirgin Islands (U.S.)West Bank and GazaWorldYemen, Rep.ZambiaZimbabwe La ligne de temps
Cette échelle de temps montre un graphique de 1961 année à 2016 année North America. Les données jusqu'à 1960 année ne sont pas présentés. Quantité d'observations actuelles selon dates: 56.
Source (désignation):
Les indicateurs du développement mondiale
Source (organisation):
World Bank staff estimates based on age distributions of United Nations Population Division's World Population Prospects.
Catégories:
Health
Dernière mise à jour
23 avr. 2017
Les indicateurs de changement de valeurs selon les années
Minimum:
9.013
1 janv. 1961
Maximum:
14.922
1 janv. 2016
Pour la date d''observation
Valeur
Changement absolu
Le changement par rapport à la valeur précédente
1 janv. 1961
9.013
+9.013
0.0%
1 janv. 1962
9.09
+0.077
0.85%
1 janv. 1963
9.164
+0.074
0.81%
1 janv. 1964
9.233
+0.069
0.75%
1 janv. 1965
9.288
+0.055
0.6%
1 janv. 1966
9.324
+0.036
0.39%
1 janv. 1967
9.375
+0.051
0.55%
1 janv. 1968
9.412
+0.037
0.39%
1 janv. 1969
9.449
+0.037
0.4%
1 janv. 1970
9.503
+0.054
0.57%
1 janv. 1971
9.578
+0.075
0.79%
1 janv. 1972
9.706
+0.128
1.34%
1 janv. 1973
9.841
+0.135
1.39%
1 janv. 1974
9.986
+0.145
1.47%
1 janv. 1975
10.135
+0.149
1.49%
1 janv. 1976
10.278
+0.143
1.41%
1 janv. 1977
10.45
+0.172
1.68%
1 janv. 1978
10.623
+0.173
1.66%
1 janv. 1979
10.803
+0.18
1.69%
1 janv. 1980
10.986
+0.183
1.69%
1 janv. 1981
11.164
+0.179
1.63%
1 janv. 1982
11.306
+0.141
1.27%
1 janv. 1983
11.432
+0.127
1.12%
1 janv. 1984
11.555
+0.123
1.07%
1 janv. 1985
11.683
+0.128
1.11%
1 janv. 1986
11.818
+0.134
1.15%
1 janv. 1987
11.94
+0.123
1.04%
1 janv. 1988
12.065
+0.124
1.04%
1 janv. 1989
12.187
+0.122
1.01%
1 janv. 1990
12.298
+0.111
0.91%
1 janv. 1991
12.393
+0.095
0.77%
1 janv. 1992
12.455
+0.062
0.5%
1 janv. 1993
12.498
+0.043
0.35%
1 janv. 1994
12.525
+0.027
0.21%
1 janv. 1995
12.535
+0.01
0.08%
1 janv. 1996
12.528
-0.007
-0.06%
1 janv. 1997
12.5
-0.028
-0.23%
1 janv. 1998
12.462
-0.038
-0.3%
1 janv. 1999
12.42
-0.042
-0.34%
1 janv. 2000
12.378
-0.042
-0.33%
1 janv. 2001
12.341
-0.037
-0.3%
1 janv. 2002
12.331
-0.009
-0.08%
1 janv. 2003
12.326
-0.005
-0.04%
1 janv. 2004
12.331
+0.005
0.04%
1 janv. 2005
12.354
+0.023
0.18%
1 janv. 2006
12.398
+0.045
0.36%
1 janv. 2007
12.475
+0.077
0.62%
1 janv. 2008
12.577
+0.102
0.82%
1 janv. 2009
12.714
+0.136
1.08%
1 janv. 2010
12.895
+0.181
1.43%
1 janv. 2011
13.125
+0.23
1.79%
1 janv. 2012
13.407
+0.281
2.14%
1 janv. 2013
13.743
+0.337
2.51%
1 janv. 2014
14.122
+0.379
2.75%
1 janv. 2015
14.52
+0.398
2.82%
1 janv. 2016
14.922
+0.401
2.76%
Classement des pays selon les statistiques actuelles par années


Commentaires: