29
/fr/
fr
AIzaSyAYiBZKx7MnpbEhh9jyipgxe19OcubqV5w
April 1, 2024
198058
Moldova
MDA
true
2
1
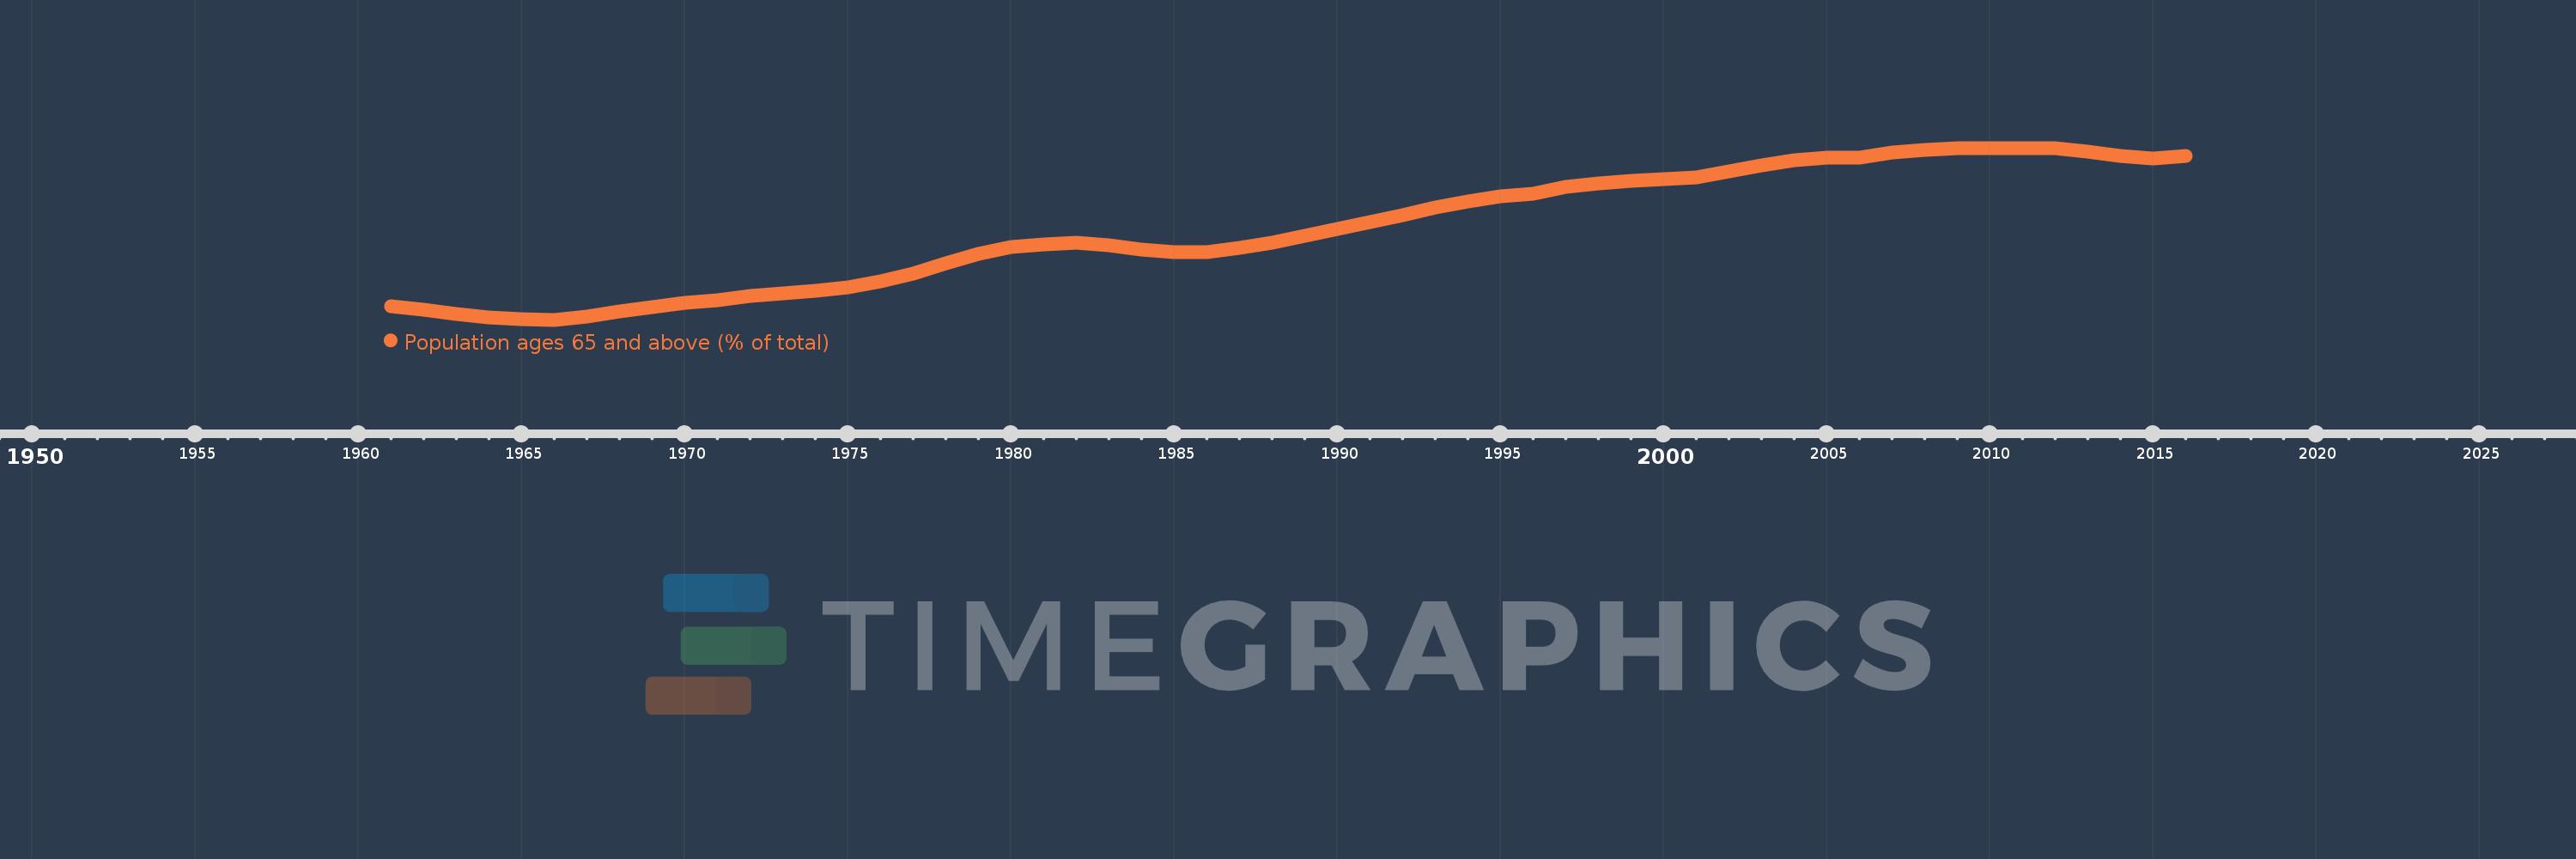
Population ages 65 and above (% of total)
2016,2015,2014,2013,2012,2011,2010,2009,2008,2007,2006,2005,2004,2003,2002,2001,2000,1999,1998,1997,1996,1995,1994,1993,1992,1991,1990,1989,1988,1987,1986,1985,1984,1983,1982,1981,1980,1979,1978,1977,1976,1975,1974,1973,1972,1971,1970,1969,1968,1967,1966,1965,1964,1963,1962,1961
Cette statistique dans les autres pays:
AfghanistanAlbaniaAlgeriaAngolaAntigua and BarbudaArab WorldArgentinaArmeniaArubaAustraliaAustriaAzerbaijanBahamas, TheBahrainBangladeshBarbadosBelarusBelgiumBelizeBeninBhutanBoliviaBosnia and HerzegovinaBotswanaBrazilBrunei DarussalamBulgariaBurkina FasoBurundiCabo VerdeCambodiaCameroonCanadaCaribbean small statesCentral African RepublicCentral Europe and the BalticsChadChannel IslandsChileChinaColombiaComorosCongo, Dem. Rep.Congo, Rep.Costa RicaCote d'IvoireCroatiaCubaCuracaoCyprusCzech RepublicDenmarkDjiboutiDominican RepublicEarly-demographic dividendEast Asia & PacificEast Asia & Pacific (excluding high income)East Asia & Pacific (IDA & IBRD countries)EcuadorEgypt, Arab Rep.El SalvadorEquatorial GuineaEritreaEstoniaEthiopiaEuro areaEurope & Central AsiaEurope & Central Asia (excluding high income)Europe & Central Asia (IDA & IBRD countries)European UnionFijiFinlandFragile and conflict affected situationsFranceFrench PolynesiaGabonGambia, TheGeorgiaGermanyGhanaGreeceGrenadaGuamGuatemalaGuineaGuinea-BissauGuyanaHaitiHeavily indebted poor countries (HIPC)High incomeHondurasHong Kong SAR, ChinaHungaryIBRD onlyIcelandIDA & IBRD totalIDA blendIDA onlyIDA totalIndiaIndonesiaIran, Islamic Rep.IraqIrelandIsraelItalyJamaicaJapanJordanKazakhstanKenyaKiribatiKorea, Dem. People’s Rep.Korea, Rep.KosovoKuwaitKyrgyz RepublicLao PDRLate-demographic dividendLatin America & Caribbean Latin America & Caribbean (excluding high income)Latin America & the Caribbean (IDA & IBRD countries)LatviaLeast developed countries: UN classificationLebanonLesothoLiberiaLibyaLithuaniaLow & middle incomeLow incomeLower middle incomeLuxembourgMacao SAR, ChinaMacedonia, FYRMadagascarMalawiMalaysiaMaldivesMaliMaltaMauritaniaMauritiusMexicoMicronesia, Fed. Sts.Middle East & North AfricaMiddle East & North Africa (excluding high income)Middle East & North Africa (IDA & IBRD countries)Middle incomeMoldovaMongoliaMontenegroMoroccoMozambiqueMyanmarNamibiaNepalNetherlandsNew CaledoniaNew ZealandNicaraguaNigerNigeriaNorth AmericaNorwayOECD membersOmanOther small statesPacific island small statesPakistanPanamaPapua New GuineaParaguayPeruPhilippinesPolandPortugalPost-demographic dividendPre-demographic dividendPuerto RicoQatarRomaniaRussian FederationRwandaSamoaSao Tome and PrincipeSaudi ArabiaSenegalSerbiaSeychellesSierra LeoneSingaporeSlovak RepublicSloveniaSmall statesSolomon IslandsSomaliaSouth AfricaSouth AsiaSouth Asia (IDA & IBRD)South SudanSpainSri LankaSt. LuciaSt. Vincent and the GrenadinesSub-Saharan Africa Sub-Saharan Africa (excluding high income)Sub-Saharan Africa (IDA & IBRD countries)SudanSurinameSwazilandSwedenSwitzerlandSyrian Arab RepublicTajikistanTanzaniaThailandTimor-LesteTogoTongaTrinidad and TobagoTunisiaTurkeyTurkmenistanUgandaUkraineUnited Arab EmiratesUnited KingdomUnited StatesUpper middle incomeUruguayUzbekistanVanuatuVenezuela, RBVietnamVirgin Islands (U.S.)West Bank and GazaWorldYemen, Rep.ZambiaZimbabwe La ligne de temps
Cette échelle de temps montre un graphique de 1961 année à 2016 année Moldova. Les données jusqu'à 1960 année ne sont pas présentés. Quantité d'observations actuelles selon dates: 56.
Source (désignation):
Les indicateurs du développement mondiale
Source (organisation):
World Bank staff estimates based on age distributions of United Nations Population Division's World Population Prospects.
Catégories:
Health
Dernière mise à jour
23 avr. 2017
Les indicateurs de changement de valeurs selon les années
Minimum:
5.843
1 janv. 1966
Maximum:
10.162
1 janv. 2010
Pour la date d''observation
Valeur
Changement absolu
Le changement par rapport à la valeur précédente
1 janv. 1961
6.179
+6.179
0.0%
1 janv. 1962
6.089
-0.09
-1.46%
1 janv. 1963
5.995
-0.094
-1.55%
1 janv. 1964
5.912
-0.083
-1.39%
1 janv. 1965
5.859
-0.053
-0.9%
1 janv. 1966
5.843
-0.015
-0.26%
1 janv. 1967
5.929
+0.086
1.47%
1 janv. 1968
6.042
+0.113
1.9%
1 janv. 1969
6.163
+0.121
2.01%
1 janv. 1970
6.265
+0.102
1.65%
1 janv. 1971
6.335
+0.07
1.11%
1 janv. 1972
6.446
+0.112
1.76%
1 janv. 1973
6.51
+0.064
0.99%
1 janv. 1974
6.564
+0.054
0.83%
1 janv. 1975
6.655
+0.091
1.38%
1 janv. 1976
6.8
+0.145
2.18%
1 janv. 1977
7.01
+0.21
3.09%
1 janv. 1978
7.262
+0.252
3.59%
1 janv. 1979
7.506
+0.243
3.35%
1 janv. 1980
7.674
+0.169
2.25%
1 janv. 1981
7.745
+0.071
0.92%
1 janv. 1982
7.772
+0.027
0.35%
1 janv. 1983
7.71
-0.062
-0.79%
1 janv. 1984
7.609
-0.101
-1.31%
1 janv. 1985
7.54
-0.07
-0.92%
1 janv. 1986
7.538
-0.001
-0.02%
1 janv. 1987
7.64
+0.102
1.35%
1 janv. 1988
7.782
+0.142
1.86%
1 janv. 1989
7.949
+0.167
2.15%
1 janv. 1990
8.122
+0.173
2.18%
1 janv. 1991
8.293
+0.171
2.1%
1 janv. 1992
8.477
+0.185
2.23%
1 janv. 1993
8.659
+0.181
2.14%
1 janv. 1994
8.822
+0.163
1.88%
1 janv. 1995
8.943
+0.121
1.38%
1 janv. 1996
9.011
+0.068
0.76%
1 janv. 1997
9.177
+0.167
1.85%
1 janv. 1998
9.276
+0.099
1.08%
1 janv. 1999
9.332
+0.056
0.6%
1 janv. 2000
9.377
+0.046
0.49%
1 janv. 2001
9.423
+0.045
0.48%
1 janv. 2002
9.571
+0.148
1.57%
1 janv. 2003
9.718
+0.148
1.54%
1 janv. 2004
9.847
+0.128
1.32%
1 janv. 2005
9.922
+0.076
0.77%
1 janv. 2006
9.927
+0.004
0.04%
1 janv. 2007
10.046
+0.12
1.2%
1 janv. 2008
10.12
+0.074
0.74%
1 janv. 2009
10.156
+0.036
0.35%
1 janv. 2010
10.162
+0.006
0.06%
1 janv. 2011
10.147
-0.015
-0.15%
1 janv. 2012
10.149
+0.002
0.02%
1 janv. 2013
10.076
-0.073
-0.72%
1 janv. 2014
9.96
-0.116
-1.15%
1 janv. 2015
9.892
-0.068
-0.68%
1 janv. 2016
9.958
+0.066
0.66%
Classement des pays selon les statistiques actuelles par années


Commentaires: