29
/fr/
fr
AIzaSyAYiBZKx7MnpbEhh9jyipgxe19OcubqV5w
April 1, 2024
137192
Gambia, The
GMB
true
2
1
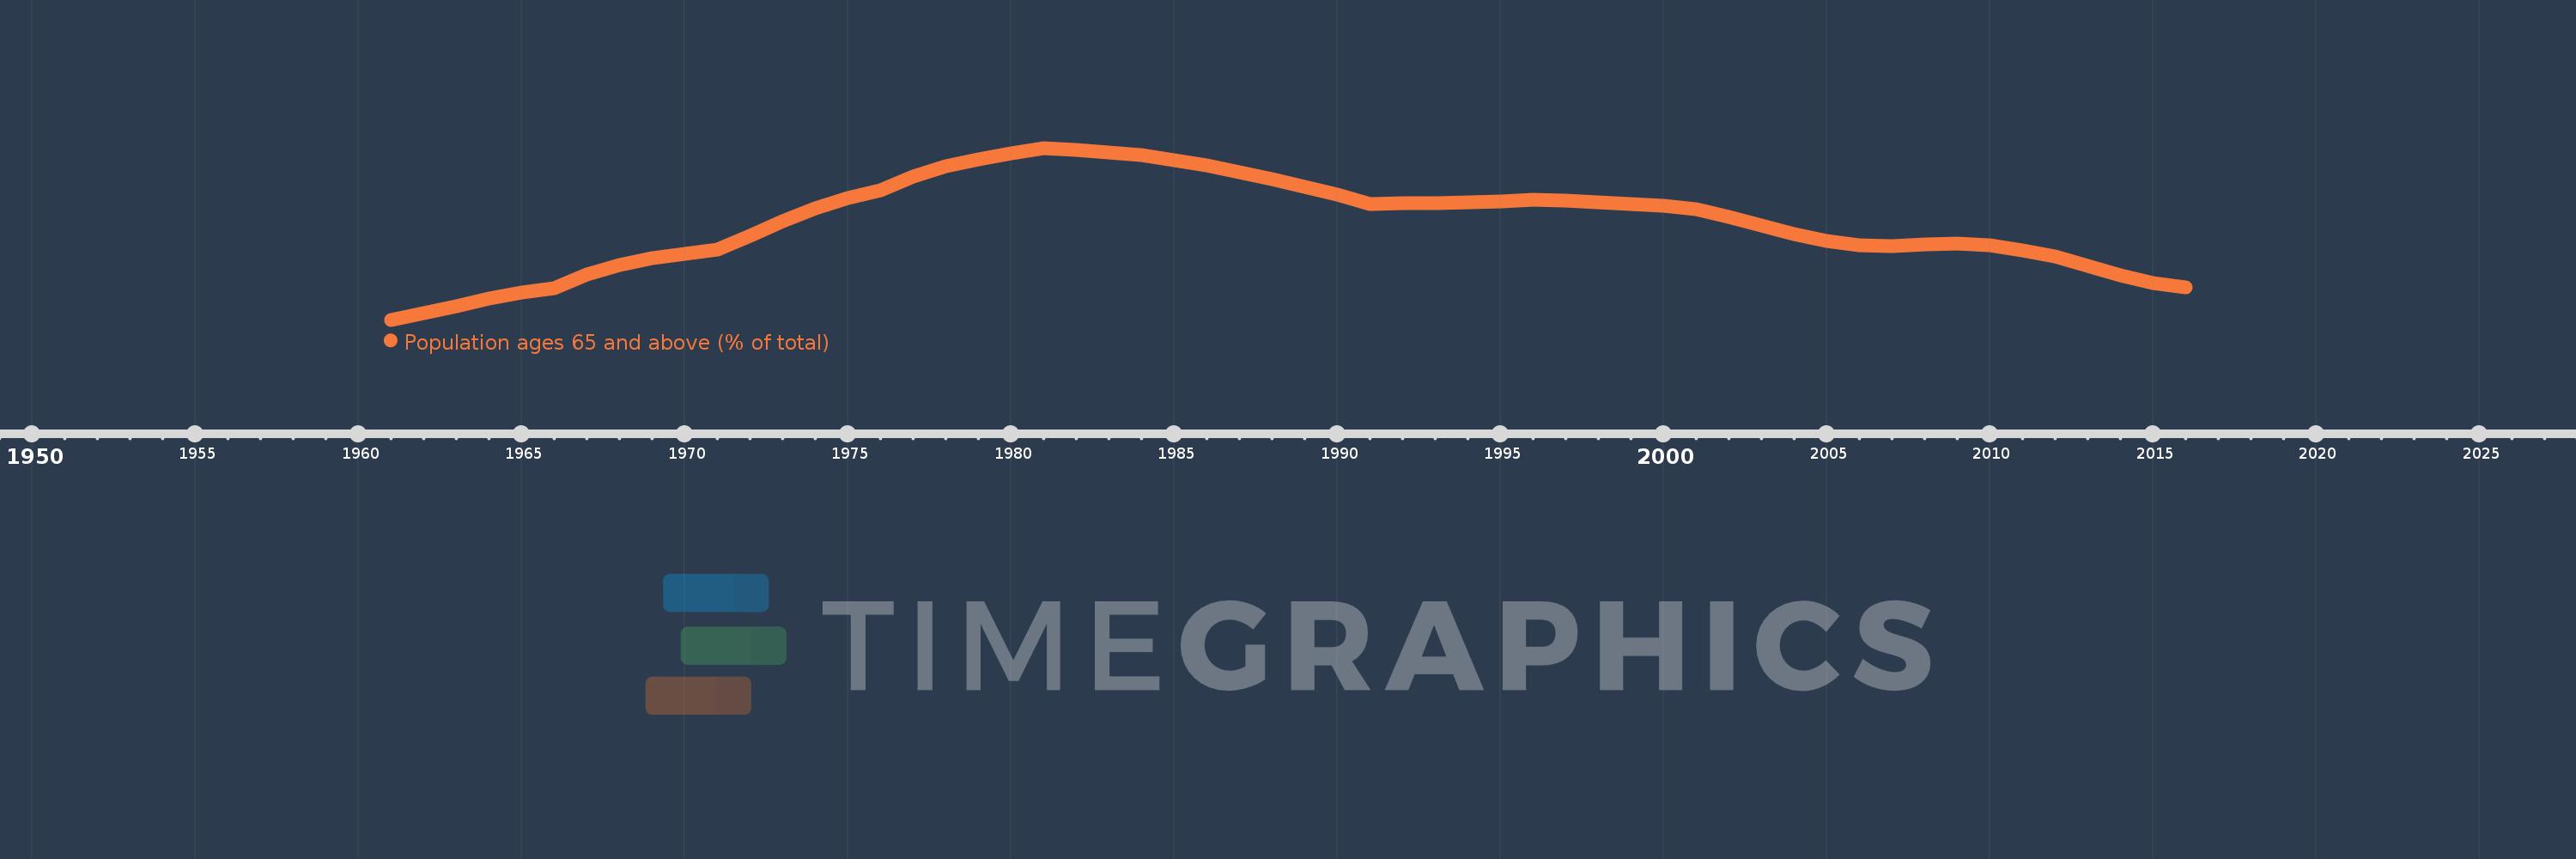
Population ages 65 and above (% of total)
2016,2015,2014,2013,2012,2011,2010,2009,2008,2007,2006,2005,2004,2003,2002,2001,2000,1999,1998,1997,1996,1995,1994,1993,1992,1991,1990,1989,1988,1987,1986,1985,1984,1983,1982,1981,1980,1979,1978,1977,1976,1975,1974,1973,1972,1971,1970,1969,1968,1967,1966,1965,1964,1963,1962,1961
Cette statistique dans les autres pays:
AfghanistanAlbaniaAlgeriaAngolaAntigua and BarbudaArab WorldArgentinaArmeniaArubaAustraliaAustriaAzerbaijanBahamas, TheBahrainBangladeshBarbadosBelarusBelgiumBelizeBeninBhutanBoliviaBosnia and HerzegovinaBotswanaBrazilBrunei DarussalamBulgariaBurkina FasoBurundiCabo VerdeCambodiaCameroonCanadaCaribbean small statesCentral African RepublicCentral Europe and the BalticsChadChannel IslandsChileChinaColombiaComorosCongo, Dem. Rep.Congo, Rep.Costa RicaCote d'IvoireCroatiaCubaCuracaoCyprusCzech RepublicDenmarkDjiboutiDominican RepublicEarly-demographic dividendEast Asia & PacificEast Asia & Pacific (excluding high income)East Asia & Pacific (IDA & IBRD countries)EcuadorEgypt, Arab Rep.El SalvadorEquatorial GuineaEritreaEstoniaEthiopiaEuro areaEurope & Central AsiaEurope & Central Asia (excluding high income)Europe & Central Asia (IDA & IBRD countries)European UnionFijiFinlandFragile and conflict affected situationsFranceFrench PolynesiaGabonGambia, TheGeorgiaGermanyGhanaGreeceGrenadaGuamGuatemalaGuineaGuinea-BissauGuyanaHaitiHeavily indebted poor countries (HIPC)High incomeHondurasHong Kong SAR, ChinaHungaryIBRD onlyIcelandIDA & IBRD totalIDA blendIDA onlyIDA totalIndiaIndonesiaIran, Islamic Rep.IraqIrelandIsraelItalyJamaicaJapanJordanKazakhstanKenyaKiribatiKorea, Dem. People’s Rep.Korea, Rep.KosovoKuwaitKyrgyz RepublicLao PDRLate-demographic dividendLatin America & Caribbean Latin America & Caribbean (excluding high income)Latin America & the Caribbean (IDA & IBRD countries)LatviaLeast developed countries: UN classificationLebanonLesothoLiberiaLibyaLithuaniaLow & middle incomeLow incomeLower middle incomeLuxembourgMacao SAR, ChinaMacedonia, FYRMadagascarMalawiMalaysiaMaldivesMaliMaltaMauritaniaMauritiusMexicoMicronesia, Fed. Sts.Middle East & North AfricaMiddle East & North Africa (excluding high income)Middle East & North Africa (IDA & IBRD countries)Middle incomeMoldovaMongoliaMontenegroMoroccoMozambiqueMyanmarNamibiaNepalNetherlandsNew CaledoniaNew ZealandNicaraguaNigerNigeriaNorth AmericaNorwayOECD membersOmanOther small statesPacific island small statesPakistanPanamaPapua New GuineaParaguayPeruPhilippinesPolandPortugalPost-demographic dividendPre-demographic dividendPuerto RicoQatarRomaniaRussian FederationRwandaSamoaSao Tome and PrincipeSaudi ArabiaSenegalSerbiaSeychellesSierra LeoneSingaporeSlovak RepublicSloveniaSmall statesSolomon IslandsSomaliaSouth AfricaSouth AsiaSouth Asia (IDA & IBRD)South SudanSpainSri LankaSt. LuciaSt. Vincent and the GrenadinesSub-Saharan Africa Sub-Saharan Africa (excluding high income)Sub-Saharan Africa (IDA & IBRD countries)SudanSurinameSwazilandSwedenSwitzerlandSyrian Arab RepublicTajikistanTanzaniaThailandTimor-LesteTogoTongaTrinidad and TobagoTunisiaTurkeyTurkmenistanUgandaUkraineUnited Arab EmiratesUnited KingdomUnited StatesUpper middle incomeUruguayUzbekistanVanuatuVenezuela, RBVietnamVirgin Islands (U.S.)West Bank and GazaWorldYemen, Rep.ZambiaZimbabwe La ligne de temps
Cette échelle de temps montre un graphique de 1961 année à 2016 année Gambia, The. Les données jusqu'à 1960 année ne sont pas présentés. Quantité d'observations actuelles selon dates: 56.
Source (désignation):
Les indicateurs du développement mondiale
Source (organisation):
World Bank staff estimates based on age distributions of United Nations Population Division's World Population Prospects.
Catégories:
Health
Dernière mise à jour
23 avr. 2017
Les indicateurs de changement de valeurs selon les années
Minimum:
2.149
1 janv. 1961
Maximum:
3.025
1 janv. 1981
Pour la date d''observation
Valeur
Changement absolu
Le changement par rapport à la valeur précédente
1 janv. 1961
2.149
+2.149
0.0%
1 janv. 1962
2.183
+0.035
1.62%
1 janv. 1963
2.219
+0.035
1.62%
1 janv. 1964
2.255
+0.036
1.63%
1 janv. 1965
2.287
+0.032
1.41%
1 janv. 1966
2.308
+0.022
0.95%
1 janv. 1967
2.378
+0.07
3.03%
1 janv. 1968
2.429
+0.051
2.15%
1 janv. 1969
2.461
+0.032
1.32%
1 janv. 1970
2.484
+0.022
0.91%
1 janv. 1971
2.507
+0.024
0.95%
1 janv. 1972
2.578
+0.071
2.82%
1 janv. 1973
2.65
+0.072
2.81%
1 janv. 1974
2.717
+0.067
2.53%
1 janv. 1975
2.771
+0.054
1.97%
1 janv. 1976
2.807
+0.037
1.32%
1 janv. 1977
2.879
+0.071
2.54%
1 janv. 1978
2.93
+0.051
1.78%
1 janv. 1979
2.968
+0.038
1.3%
1 janv. 1980
2.999
+0.031
1.04%
1 janv. 1981
3.025
+0.026
0.85%
1 janv. 1982
3.015
-0.009
-0.3%
1 janv. 1983
3.003
-0.012
-0.41%
1 janv. 1984
2.987
-0.016
-0.54%
1 janv. 1985
2.964
-0.023
-0.78%
1 janv. 1986
2.934
-0.03
-1.03%
1 janv. 1987
2.903
-0.03
-1.04%
1 janv. 1988
2.868
-0.035
-1.22%
1 janv. 1989
2.828
-0.04
-1.39%
1 janv. 1990
2.785
-0.043
-1.54%
1 janv. 1991
2.74
-0.045
-1.6%
1 janv. 1992
2.743
+0.003
0.1%
1 janv. 1993
2.744
+0.001
0.03%
1 janv. 1994
2.746
+0.003
0.1%
1 janv. 1995
2.753
+0.006
0.23%
1 janv. 1996
2.763
+0.01
0.38%
1 janv. 1997
2.755
-0.008
-0.29%
1 janv. 1998
2.749
-0.006
-0.23%
1 janv. 1999
2.741
-0.008
-0.28%
1 janv. 2000
2.729
-0.012
-0.43%
1 janv. 2001
2.714
-0.015
-0.56%
1 janv. 2002
2.673
-0.041
-1.51%
1 janv. 2003
2.628
-0.045
-1.67%
1 janv. 2004
2.585
-0.043
-1.64%
1 janv. 2005
2.551
-0.034
-1.3%
1 janv. 2006
2.53
-0.021
-0.82%
1 janv. 2007
2.526
-0.004
-0.15%
1 janv. 2008
2.532
+0.005
0.21%
1 janv. 2009
2.537
+0.005
0.2%
1 janv. 2010
2.529
-0.008
-0.3%
1 janv. 2011
2.504
-0.025
-0.98%
1 janv. 2012
2.471
-0.033
-1.33%
1 janv. 2013
2.424
-0.047
-1.89%
1 janv. 2014
2.375
-0.049
-2.04%
1 janv. 2015
2.336
-0.039
-1.64%
1 janv. 2016
2.314
-0.022
-0.94%
Classement des pays selon les statistiques actuelles par années


Commentaires: