29
/fr/
fr
AIzaSyAYiBZKx7MnpbEhh9jyipgxe19OcubqV5w
April 1, 2024
72667
Australia
AUS
true
2
1
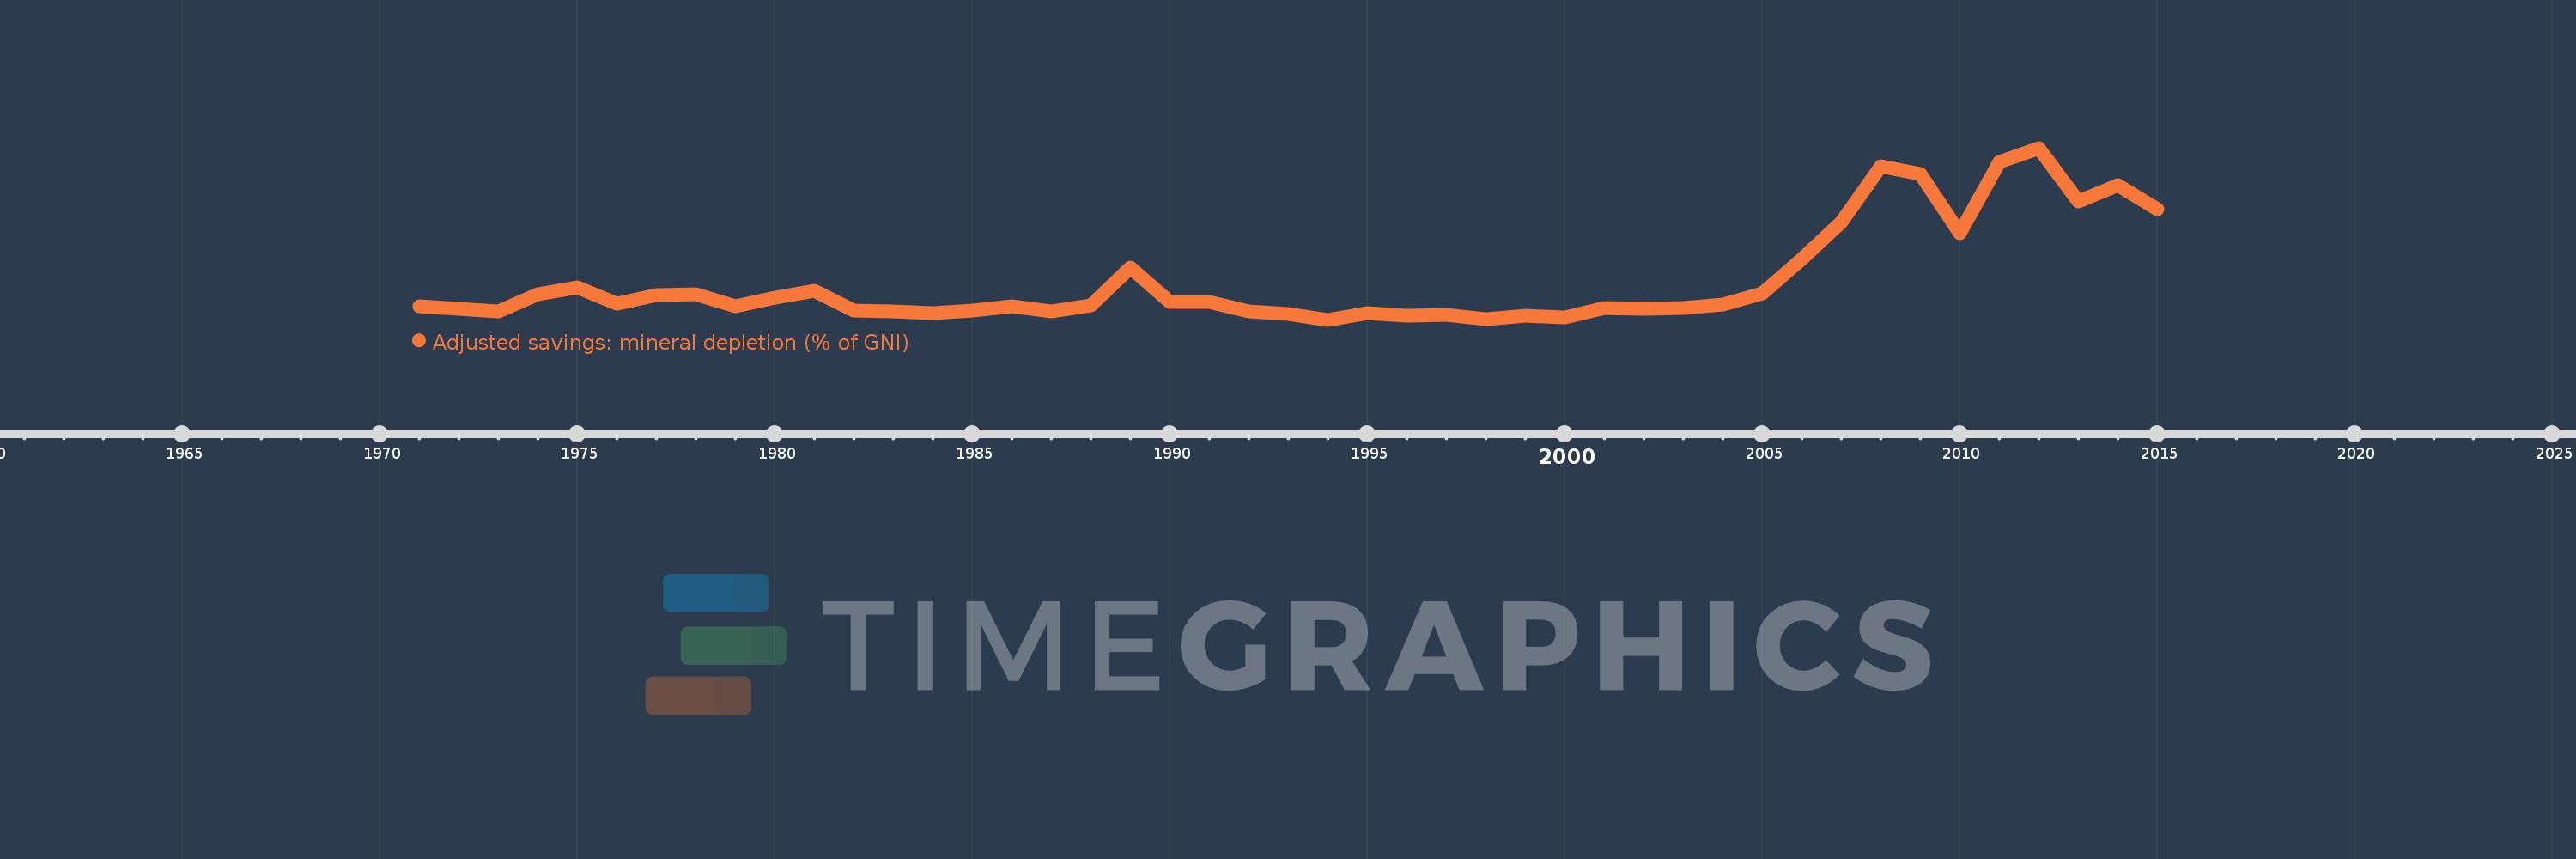
Adjusted savings: mineral depletion (% of GNI)
2015,2014,2013,2012,2011,2010,2009,2008,2007,2006,2005,2004,2003,2002,2001,2000,1999,1998,1997,1996,1995,1994,1993,1992,1991,1990,1989,1988,1987,1986,1985,1984,1983,1982,1981,1980,1979,1978,1977,1976,1975,1974,1973,1972,1971
Cette statistique dans les autres pays:
AfghanistanAlbaniaAlgeriaAmerican SamoaAndorraAngolaAntigua and BarbudaArab WorldArgentinaArmeniaAustraliaAustriaAzerbaijanBahamas, TheBahrainBangladeshBarbadosBelarusBelgiumBelizeBeninBermudaBhutanBoliviaBosnia and HerzegovinaBotswanaBrazilBrunei DarussalamBulgariaBurkina FasoBurundiCabo VerdeCambodiaCameroonCanadaCaribbean small statesCentral African RepublicCentral Europe and the BalticsChadChannel IslandsChileChinaColombiaComorosCongo, Dem. Rep.Congo, Rep.Costa RicaCote d'IvoireCroatiaCubaCyprusCzech RepublicDenmarkDjiboutiDominicaDominican RepublicEarly-demographic dividendEast Asia & PacificEast Asia & Pacific (excluding high income)East Asia & Pacific (IDA & IBRD countries)EcuadorEgypt, Arab Rep.El SalvadorEquatorial GuineaEritreaEstoniaEthiopiaEuro areaEurope & Central AsiaEurope & Central Asia (excluding high income)Europe & Central Asia (IDA & IBRD countries)European UnionFaroe IslandsFijiFinlandFragile and conflict affected situationsFranceFrench PolynesiaGabonGambia, TheGeorgiaGermanyGhanaGreeceGreenlandGrenadaGuatemalaGuineaGuinea-BissauGuyanaHaitiHeavily indebted poor countries (HIPC)High incomeHondurasHong Kong SAR, ChinaHungaryIBRD onlyIcelandIDA & IBRD totalIDA blendIDA onlyIDA totalIndiaIndonesiaIran, Islamic Rep.IraqIrelandIsle of ManIsraelItalyJamaicaJapanJordanKazakhstanKenyaKiribatiKorea, Rep.KosovoKuwaitKyrgyz RepublicLao PDRLate-demographic dividendLatin America & Caribbean Latin America & Caribbean (excluding high income)Latin America & the Caribbean (IDA & IBRD countries)LatviaLeast developed countries: UN classificationLebanonLesothoLiberiaLibyaLiechtensteinLithuaniaLow & middle incomeLow incomeLower middle incomeLuxembourgMacao SAR, ChinaMacedonia, FYRMadagascarMalawiMalaysiaMaldivesMaliMaltaMarshall IslandsMauritaniaMauritiusMexicoMicronesia, Fed. Sts.Middle East & North AfricaMiddle East & North Africa (excluding high income)Middle East & North Africa (IDA & IBRD countries)Middle incomeMoldovaMonacoMongoliaMontenegroMoroccoMozambiqueMyanmarNamibiaNepalNetherlandsNew CaledoniaNew ZealandNicaraguaNigerNigeriaNorth AmericaNorwayOECD membersOmanOther small statesPacific island small statesPakistanPalauPanamaPapua New GuineaParaguayPeruPhilippinesPolandPortugalPost-demographic dividendPre-demographic dividendPuerto RicoQatarRomaniaRussian FederationRwandaSamoaSan MarinoSao Tome and PrincipeSaudi ArabiaSenegalSerbiaSeychellesSierra LeoneSingaporeSlovak RepublicSloveniaSmall statesSolomon IslandsSomaliaSouth AfricaSouth AsiaSouth Asia (IDA & IBRD)South SudanSpainSri LankaSt. Kitts and NevisSt. LuciaSt. Vincent and the GrenadinesSub-Saharan Africa Sub-Saharan Africa (excluding high income)Sub-Saharan Africa (IDA & IBRD countries)SudanSurinameSwazilandSwedenSwitzerlandSyrian Arab RepublicTajikistanTanzaniaThailandTimor-LesteTogoTongaTrinidad and TobagoTunisiaTurkeyTurkmenistanTuvaluUgandaUkraineUnited Arab EmiratesUnited KingdomUnited StatesUpper middle incomeUruguayUzbekistanVanuatuVenezuela, RBVietnamVirgin Islands (U.S.)West Bank and GazaWorldYemen, Rep.ZambiaZimbabwe La ligne de temps
Cette échelle de temps montre un graphique de 1971 année à 2015 année Australia. Les données jusqu'à 1970 année ne sont pas présentés. Quantité d'observations actuelles selon dates: 45.
Source (désignation):
Les indicateurs du développement mondiale
Source (organisation):
World Bank staff estimates based on sources and methods in World Bank's "The Changing Wealth of Nations: Measuring Sustainable Development in the New Millennium" (2011).
Catégories:
Economy & Growth, Energy & Mining, Environment
Dernière mise à jour
23 avr. 2017
Les indicateurs de changement de valeurs selon les années
Minimum:
0.486
1 janv. 1994
Maximum:
3.481
1 janv. 2012
Pour la date d''observation
Valeur
Changement absolu
Le changement par rapport à la valeur précédente
1 janv. 1971
0.718
+0.718
0.0%
1 janv. 1972
0.673
-0.045
-6.22%
1 janv. 1973
0.632
-0.041
-6.14%
1 janv. 1974
0.937
+0.305
48.28%
1 janv. 1975
1.054
+0.117
12.5%
1 janv. 1976
0.772
-0.283
-26.79%
1 janv. 1977
0.918
+0.146
18.94%
1 janv. 1978
0.938
+0.02
2.2%
1 janv. 1979
0.714
-0.225
-23.95%
1 janv. 1980
0.864
+0.151
21.1%
1 janv. 1981
0.994
+0.13
15.08%
1 janv. 1982
0.645
-0.349
-35.14%
1 janv. 1983
0.631
-0.014
-2.2%
1 janv. 1984
0.596
-0.034
-5.44%
1 janv. 1985
0.649
+0.052
8.8%
1 janv. 1986
0.727
+0.078
12.05%
1 janv. 1987
0.631
-0.096
-13.2%
1 janv. 1988
0.74
+0.108
17.18%
1 janv. 1989
1.393
+0.653
88.35%
1 janv. 1990
0.791
-0.602
-43.22%
1 janv. 1991
0.794
+0.003
0.44%
1 janv. 1992
0.631
-0.163
-20.55%
1 janv. 1993
0.582
-0.049
-7.74%
1 janv. 1994
0.486
-0.096
-16.49%
1 janv. 1995
0.599
+0.113
23.23%
1 janv. 1996
0.551
-0.048
-8.06%
1 janv. 1997
0.565
+0.014
2.53%
1 janv. 1998
0.494
-0.071
-12.54%
1 janv. 1999
0.563
+0.069
14.0%
1 janv. 2000
0.532
-0.031
-5.49%
1 janv. 2001
0.694
+0.162
30.43%
1 janv. 2002
0.68
-0.015
-2.11%
1 janv. 2003
0.693
+0.013
1.97%
1 janv. 2004
0.755
+0.062
8.97%
1 janv. 2005
0.944
+0.188
24.94%
1 janv. 2006
1.539
+0.596
63.12%
1 janv. 2007
2.191
+0.651
42.32%
1 janv. 2008
3.16
+0.969
44.24%
1 janv. 2009
3.02
-0.14
-4.42%
1 janv. 2010
1.999
-1.021
-33.82%
1 janv. 2011
3.242
+1.243
62.18%
1 janv. 2012
3.481
+0.239
7.38%
1 janv. 2013
2.542
-0.939
-26.97%
1 janv. 2014
2.828
+0.286
11.26%
1 janv. 2015
2.411
-0.418
-14.76%
Classement des pays selon les statistiques actuelles par années


Commentaires: