29
/fr/
fr
AIzaSyAYiBZKx7MnpbEhh9jyipgxe19OcubqV5w
April 1, 2024
62349
World
WLD
false
2
1
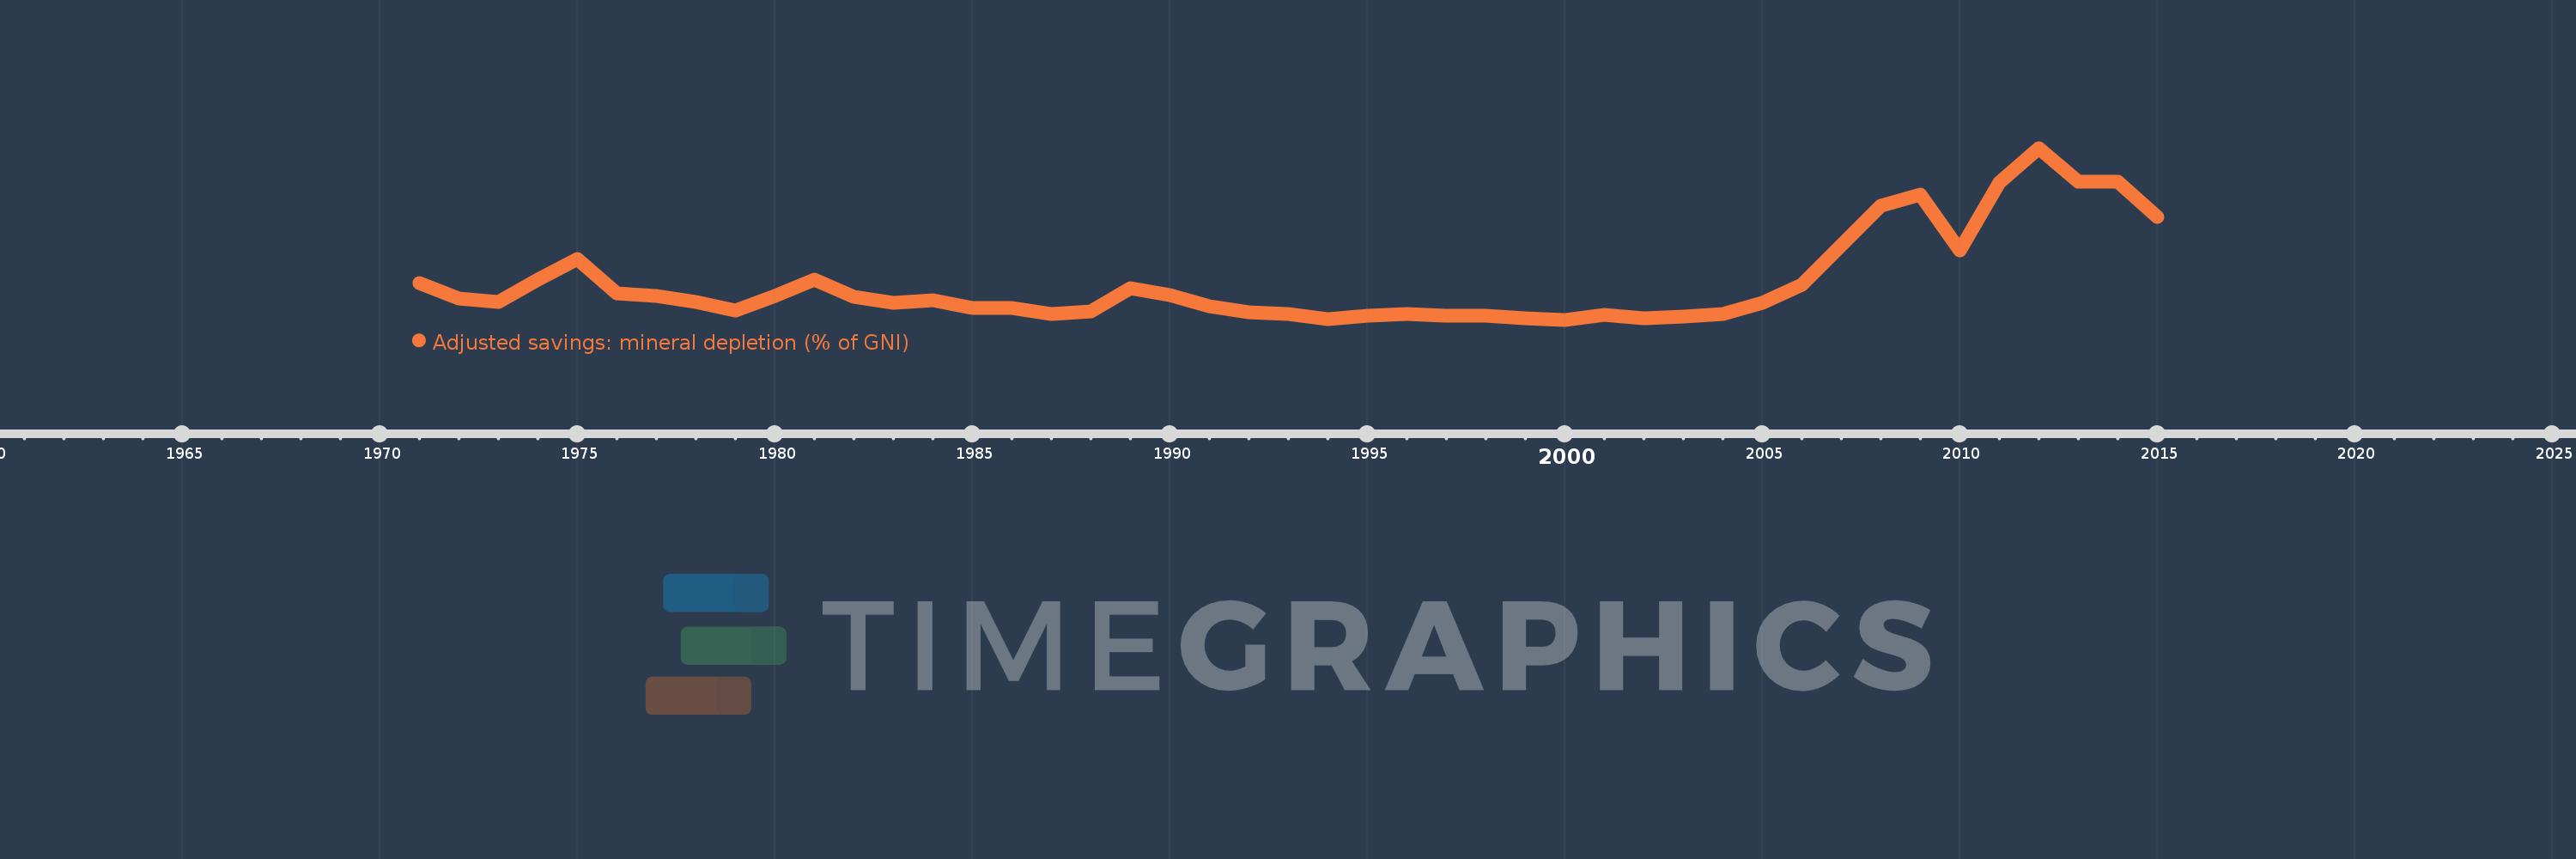
Adjusted savings: mineral depletion (% of GNI)
2015,2014,2013,2012,2011,2010,2009,2008,2007,2006,2005,2004,2003,2002,2001,2000,1999,1998,1997,1996,1995,1994,1993,1992,1991,1990,1989,1988,1987,1986,1985,1984,1983,1982,1981,1980,1979,1978,1977,1976,1975,1974,1973,1972,1971
Cette statistique dans les autres pays:
AfghanistanAlbaniaAlgeriaAmerican SamoaAndorraAngolaAntigua and BarbudaArab WorldArgentinaArmeniaAustraliaAustriaAzerbaijanBahamas, TheBahrainBangladeshBarbadosBelarusBelgiumBelizeBeninBermudaBhutanBoliviaBosnia and HerzegovinaBotswanaBrazilBrunei DarussalamBulgariaBurkina FasoBurundiCabo VerdeCambodiaCameroonCanadaCaribbean small statesCentral African RepublicCentral Europe and the BalticsChadChannel IslandsChileChinaColombiaComorosCongo, Dem. Rep.Congo, Rep.Costa RicaCote d'IvoireCroatiaCubaCyprusCzech RepublicDenmarkDjiboutiDominicaDominican RepublicEarly-demographic dividendEast Asia & PacificEast Asia & Pacific (excluding high income)East Asia & Pacific (IDA & IBRD countries)EcuadorEgypt, Arab Rep.El SalvadorEquatorial GuineaEritreaEstoniaEthiopiaEuro areaEurope & Central AsiaEurope & Central Asia (excluding high income)Europe & Central Asia (IDA & IBRD countries)European UnionFaroe IslandsFijiFinlandFragile and conflict affected situationsFranceFrench PolynesiaGabonGambia, TheGeorgiaGermanyGhanaGreeceGreenlandGrenadaGuatemalaGuineaGuinea-BissauGuyanaHaitiHeavily indebted poor countries (HIPC)High incomeHondurasHong Kong SAR, ChinaHungaryIBRD onlyIcelandIDA & IBRD totalIDA blendIDA onlyIDA totalIndiaIndonesiaIran, Islamic Rep.IraqIrelandIsle of ManIsraelItalyJamaicaJapanJordanKazakhstanKenyaKiribatiKorea, Rep.KosovoKuwaitKyrgyz RepublicLao PDRLate-demographic dividendLatin America & Caribbean Latin America & Caribbean (excluding high income)Latin America & the Caribbean (IDA & IBRD countries)LatviaLeast developed countries: UN classificationLebanonLesothoLiberiaLibyaLiechtensteinLithuaniaLow & middle incomeLow incomeLower middle incomeLuxembourgMacao SAR, ChinaMacedonia, FYRMadagascarMalawiMalaysiaMaldivesMaliMaltaMarshall IslandsMauritaniaMauritiusMexicoMicronesia, Fed. Sts.Middle East & North AfricaMiddle East & North Africa (excluding high income)Middle East & North Africa (IDA & IBRD countries)Middle incomeMoldovaMonacoMongoliaMontenegroMoroccoMozambiqueMyanmarNamibiaNepalNetherlandsNew CaledoniaNew ZealandNicaraguaNigerNigeriaNorth AmericaNorwayOECD membersOmanOther small statesPacific island small statesPakistanPalauPanamaPapua New GuineaParaguayPeruPhilippinesPolandPortugalPost-demographic dividendPre-demographic dividendPuerto RicoQatarRomaniaRussian FederationRwandaSamoaSan MarinoSao Tome and PrincipeSaudi ArabiaSenegalSerbiaSeychellesSierra LeoneSingaporeSlovak RepublicSloveniaSmall statesSolomon IslandsSomaliaSouth AfricaSouth AsiaSouth Asia (IDA & IBRD)South SudanSpainSri LankaSt. Kitts and NevisSt. LuciaSt. Vincent and the GrenadinesSub-Saharan Africa Sub-Saharan Africa (excluding high income)Sub-Saharan Africa (IDA & IBRD countries)SudanSurinameSwazilandSwedenSwitzerlandSyrian Arab RepublicTajikistanTanzaniaThailandTimor-LesteTogoTongaTrinidad and TobagoTunisiaTurkeyTurkmenistanTuvaluUgandaUkraineUnited Arab EmiratesUnited KingdomUnited StatesUpper middle incomeUruguayUzbekistanVanuatuVenezuela, RBVietnamVirgin Islands (U.S.)West Bank and GazaWorldYemen, Rep.ZambiaZimbabwe La ligne de temps
Cette échelle de temps montre un graphique de 1971 année à 2015 année World. Les données jusqu'à 1970 année ne sont pas présentés. Quantité d'observations actuelles selon dates: 45.
Source (désignation):
Les indicateurs du développement mondiale
Source (organisation):
World Bank staff estimates based on sources and methods in World Bank's "The Changing Wealth of Nations: Measuring Sustainable Development in the New Millennium" (2011).
Catégories:
Economy & Growth, Energy & Mining, Environment
Dernière mise à jour
23 avr. 2017
Les indicateurs de changement de valeurs selon les années
Minimum:
0.036
1 janv. 2000
Maximum:
0.593
1 janv. 2012
Pour la date d''observation
Valeur
Changement absolu
Le changement par rapport à la valeur précédente
1 janv. 1971
0.155
+0.155
0.0%
1 janv. 1972
0.105
-0.05
-32.16%
1 janv. 1973
0.095
-0.01
-9.54%
1 janv. 1974
0.166
+0.071
74.35%
1 janv. 1975
0.232
+0.067
40.36%
1 janv. 1976
0.121
-0.111
-47.95%
1 janv. 1977
0.114
-0.007
-5.61%
1 janv. 1978
0.094
-0.02
-17.28%
1 janv. 1979
0.065
-0.03
-31.3%
1 janv. 1980
0.112
+0.047
72.6%
1 janv. 1981
0.167
+0.055
49.13%
1 janv. 1982
0.111
-0.056
-33.59%
1 janv. 1983
0.09
-0.021
-19.08%
1 janv. 1984
0.1
+0.011
11.98%
1 janv. 1985
0.073
-0.028
-27.77%
1 janv. 1986
0.075
+0.003
3.45%
1 janv. 1987
0.054
-0.021
-28.42%
1 janv. 1988
0.064
+0.011
19.94%
1 janv. 1989
0.138
+0.073
113.64%
1 janv. 1990
0.116
-0.022
-16.11%
1 janv. 1991
0.081
-0.034
-29.56%
1 janv. 1992
0.06
-0.021
-25.83%
1 janv. 1993
0.054
-0.006
-10.04%
1 janv. 1994
0.037
-0.017
-31.04%
1 janv. 1995
0.049
+0.012
31.37%
1 janv. 1996
0.056
+0.007
14.46%
1 janv. 1997
0.049
-0.007
-12.89%
1 janv. 1998
0.049
0.0
-0.72%
1 janv. 1999
0.041
-0.007
-15.28%
1 janv. 2000
0.036
-0.005
-12.32%
1 janv. 2001
0.053
+0.017
47.72%
1 janv. 2002
0.042
-0.012
-22.23%
1 janv. 2003
0.046
+0.005
11.7%
1 janv. 2004
0.056
+0.01
21.69%
1 janv. 2005
0.092
+0.035
62.35%
1 janv. 2006
0.15
+0.059
63.93%
1 janv. 2007
0.277
+0.127
84.38%
1 janv. 2008
0.406
+0.129
46.57%
1 janv. 2009
0.442
+0.036
8.88%
1 janv. 2010
0.262
-0.18
-40.76%
1 janv. 2011
0.482
+0.22
83.8%
1 janv. 2012
0.593
+0.111
23.14%
1 janv. 2013
0.483
-0.111
-18.64%
1 janv. 2014
0.483
+0.001
0.14%
1 janv. 2015
0.368
-0.115
-23.86%
Classement des pays selon les statistiques actuelles par années


Commentaires: