29
/fr/
fr
AIzaSyAYiBZKx7MnpbEhh9jyipgxe19OcubqV5w
April 1, 2024
42067
Latin America & Caribbean (excluding high income)
LAC
false
2
1
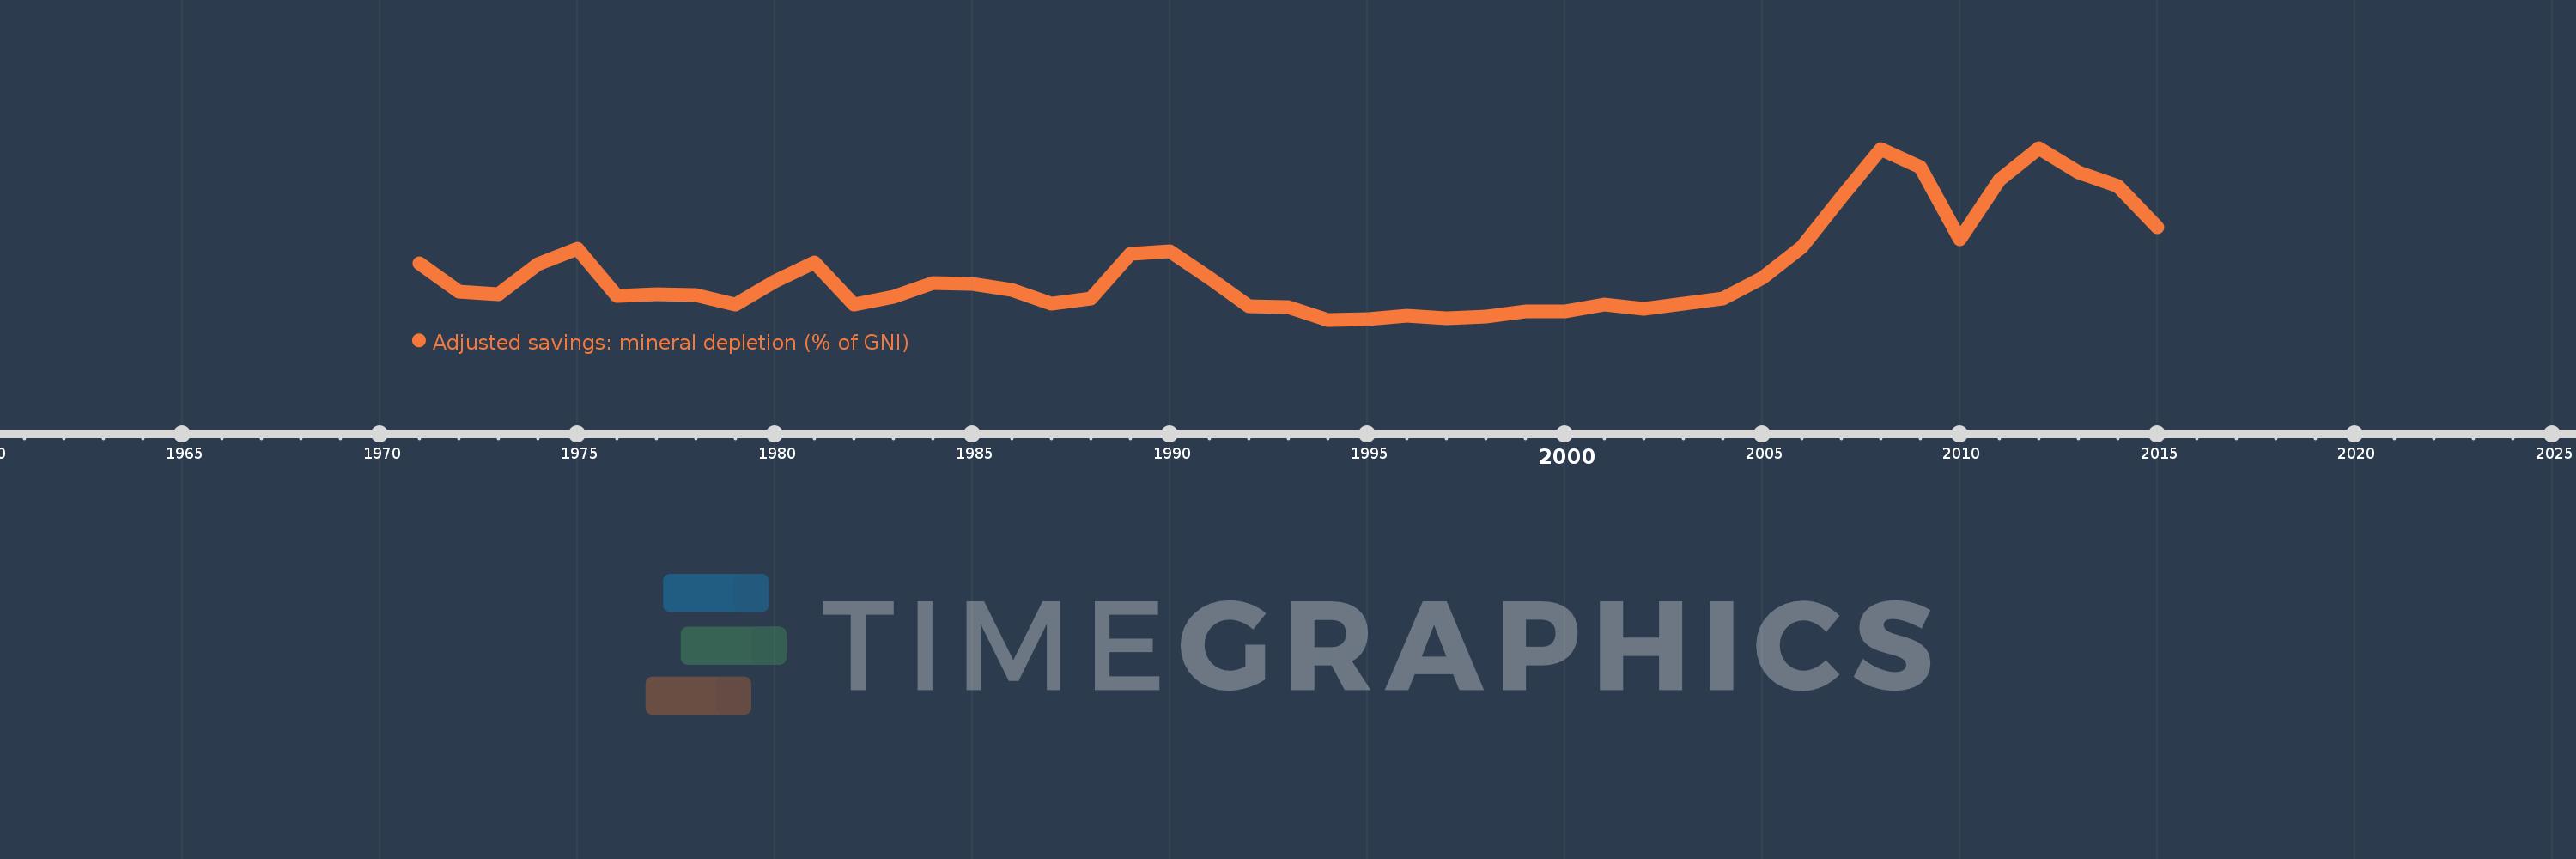
Adjusted savings: mineral depletion (% of GNI)
2015,2014,2013,2012,2011,2010,2009,2008,2007,2006,2005,2004,2003,2002,2001,2000,1999,1998,1997,1996,1995,1994,1993,1992,1991,1990,1989,1988,1987,1986,1985,1984,1983,1982,1981,1980,1979,1978,1977,1976,1975,1974,1973,1972,1971
Cette statistique dans les autres pays:
AfghanistanAlbaniaAlgeriaAmerican SamoaAndorraAngolaAntigua and BarbudaArab WorldArgentinaArmeniaAustraliaAustriaAzerbaijanBahamas, TheBahrainBangladeshBarbadosBelarusBelgiumBelizeBeninBermudaBhutanBoliviaBosnia and HerzegovinaBotswanaBrazilBrunei DarussalamBulgariaBurkina FasoBurundiCabo VerdeCambodiaCameroonCanadaCaribbean small statesCentral African RepublicCentral Europe and the BalticsChadChannel IslandsChileChinaColombiaComorosCongo, Dem. Rep.Congo, Rep.Costa RicaCote d'IvoireCroatiaCubaCyprusCzech RepublicDenmarkDjiboutiDominicaDominican RepublicEarly-demographic dividendEast Asia & PacificEast Asia & Pacific (excluding high income)East Asia & Pacific (IDA & IBRD countries)EcuadorEgypt, Arab Rep.El SalvadorEquatorial GuineaEritreaEstoniaEthiopiaEuro areaEurope & Central AsiaEurope & Central Asia (excluding high income)Europe & Central Asia (IDA & IBRD countries)European UnionFaroe IslandsFijiFinlandFragile and conflict affected situationsFranceFrench PolynesiaGabonGambia, TheGeorgiaGermanyGhanaGreeceGreenlandGrenadaGuatemalaGuineaGuinea-BissauGuyanaHaitiHeavily indebted poor countries (HIPC)High incomeHondurasHong Kong SAR, ChinaHungaryIBRD onlyIcelandIDA & IBRD totalIDA blendIDA onlyIDA totalIndiaIndonesiaIran, Islamic Rep.IraqIrelandIsle of ManIsraelItalyJamaicaJapanJordanKazakhstanKenyaKiribatiKorea, Rep.KosovoKuwaitKyrgyz RepublicLao PDRLate-demographic dividendLatin America & Caribbean Latin America & Caribbean (excluding high income)Latin America & the Caribbean (IDA & IBRD countries)LatviaLeast developed countries: UN classificationLebanonLesothoLiberiaLibyaLiechtensteinLithuaniaLow & middle incomeLow incomeLower middle incomeLuxembourgMacao SAR, ChinaMacedonia, FYRMadagascarMalawiMalaysiaMaldivesMaliMaltaMarshall IslandsMauritaniaMauritiusMexicoMicronesia, Fed. Sts.Middle East & North AfricaMiddle East & North Africa (excluding high income)Middle East & North Africa (IDA & IBRD countries)Middle incomeMoldovaMonacoMongoliaMontenegroMoroccoMozambiqueMyanmarNamibiaNepalNetherlandsNew CaledoniaNew ZealandNicaraguaNigerNigeriaNorth AmericaNorwayOECD membersOmanOther small statesPacific island small statesPakistanPalauPanamaPapua New GuineaParaguayPeruPhilippinesPolandPortugalPost-demographic dividendPre-demographic dividendPuerto RicoQatarRomaniaRussian FederationRwandaSamoaSan MarinoSao Tome and PrincipeSaudi ArabiaSenegalSerbiaSeychellesSierra LeoneSingaporeSlovak RepublicSloveniaSmall statesSolomon IslandsSomaliaSouth AfricaSouth AsiaSouth Asia (IDA & IBRD)South SudanSpainSri LankaSt. Kitts and NevisSt. LuciaSt. Vincent and the GrenadinesSub-Saharan Africa Sub-Saharan Africa (excluding high income)Sub-Saharan Africa (IDA & IBRD countries)SudanSurinameSwazilandSwedenSwitzerlandSyrian Arab RepublicTajikistanTanzaniaThailandTimor-LesteTogoTongaTrinidad and TobagoTunisiaTurkeyTurkmenistanTuvaluUgandaUkraineUnited Arab EmiratesUnited KingdomUnited StatesUpper middle incomeUruguayUzbekistanVanuatuVenezuela, RBVietnamVirgin Islands (U.S.)West Bank and GazaWorldYemen, Rep.ZambiaZimbabwe La ligne de temps
Cette échelle de temps montre un graphique de 1971 année à 2015 année Latin America & Caribbean (excluding high income). Les données jusqu'à 1970 année ne sont pas présentés. Quantité d'observations actuelles selon dates: 45.
Source (désignation):
Les indicateurs du développement mondiale
Source (organisation):
World Bank staff estimates based on sources and methods in World Bank's "The Changing Wealth of Nations: Measuring Sustainable Development in the New Millennium" (2011).
Catégories:
Economy & Growth, Energy & Mining, Environment
Dernière mise à jour
23 avr. 2017
Les indicateurs de changement de valeurs selon les années
Minimum:
0.104
1 janv. 1994
Pour la date d''observation
Valeur
Changement absolu
Le changement par rapport à la valeur précédente
1 janv. 1971
0.433
+0.433
0.0%
1 janv. 1972
0.27
-0.163
-37.65%
1 janv. 1973
0.255
-0.015
-5.58%
1 janv. 1974
0.43
+0.175
68.62%
1 janv. 1975
0.521
+0.092
21.38%
1 janv. 1976
0.243
-0.279
-53.43%
1 janv. 1977
0.254
+0.011
4.54%
1 janv. 1978
0.25
-0.004
-1.39%
1 janv. 1979
0.192
-0.058
-23.15%
1 janv. 1980
0.327
+0.134
69.75%
1 janv. 1981
0.439
+0.112
34.41%
1 janv. 1982
0.192
-0.247
-56.15%
1 janv. 1983
0.238
+0.045
23.56%
1 janv. 1984
0.321
+0.083
34.81%
1 janv. 1985
0.314
-0.007
-2.2%
1 janv. 1986
0.278
-0.036
-11.48%
1 janv. 1987
0.197
-0.081
-29.12%
1 janv. 1988
0.23
+0.033
16.94%
1 janv. 1989
0.49
+0.26
112.89%
1 janv. 1990
0.507
+0.017
3.44%
1 janv. 1991
0.349
-0.158
-31.18%
1 janv. 1992
0.181
-0.168
-48.04%
1 janv. 1993
0.177
-0.004
-2.39%
1 janv. 1994
0.104
-0.073
-41.31%
1 janv. 1995
0.11
+0.006
5.59%
1 janv. 1996
0.13
+0.02
18.29%
1 janv. 1997
0.112
-0.018
-13.92%
1 janv. 1998
0.124
+0.012
10.96%
1 janv. 1999
0.155
+0.031
25.03%
1 janv. 2000
0.153
-0.002
-1.26%
1 janv. 2001
0.192
+0.039
25.3%
1 janv. 2002
0.166
-0.026
-13.43%
1 janv. 2003
0.199
+0.033
20.07%
1 janv. 2004
0.23
+0.031
15.48%
1 janv. 2005
0.35
+0.12
52.12%
1 janv. 2006
0.531
+0.181
51.88%
1 janv. 2007
0.821
+0.289
54.49%
1 janv. 2008
1.104
+0.283
34.52%
1 janv. 2009
0.997
-0.107
-9.7%
1 janv. 2010
0.575
-0.422
-42.36%
1 janv. 2011
0.922
+0.347
60.45%
1 janv. 2012
1.11
+0.188
20.38%
1 janv. 2013
0.966
-0.144
-12.97%
1 janv. 2014
0.889
-0.077
-7.97%
1 janv. 2015
0.645
-0.243
-27.4%
Classement des pays selon les statistiques actuelles par années


Commentaires: