29
/fr/
fr
AIzaSyAYiBZKx7MnpbEhh9jyipgxe19OcubqV5w
April 1, 2024
132853
Finland
FIN
true
2
1
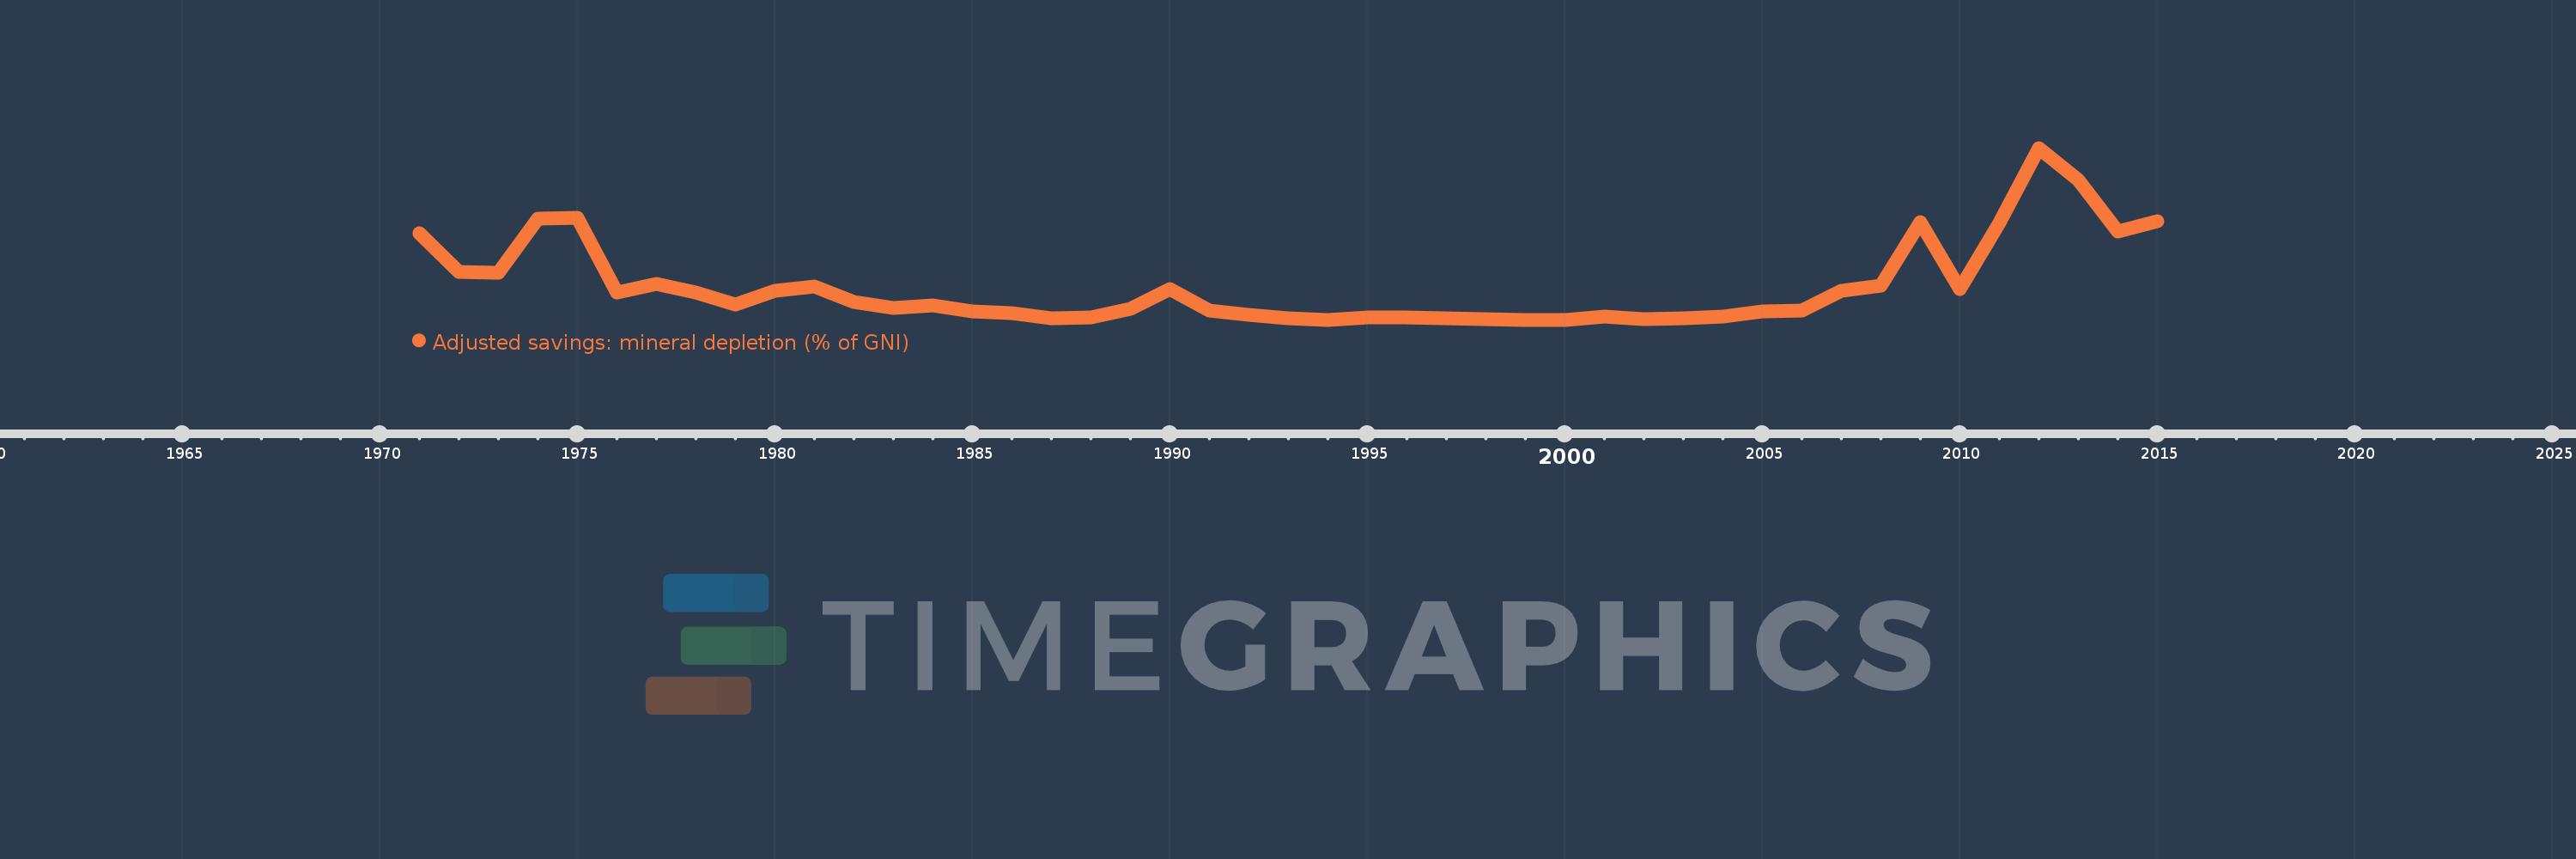
Adjusted savings: mineral depletion (% of GNI)
2015,2014,2013,2012,2011,2010,2009,2008,2007,2006,2005,2004,2003,2002,2001,2000,1999,1998,1997,1996,1995,1994,1993,1992,1991,1990,1989,1988,1987,1986,1985,1984,1983,1982,1981,1980,1979,1978,1977,1976,1975,1974,1973,1972,1971
Cette statistique dans les autres pays:
AfghanistanAlbaniaAlgeriaAmerican SamoaAndorraAngolaAntigua and BarbudaArab WorldArgentinaArmeniaAustraliaAustriaAzerbaijanBahamas, TheBahrainBangladeshBarbadosBelarusBelgiumBelizeBeninBermudaBhutanBoliviaBosnia and HerzegovinaBotswanaBrazilBrunei DarussalamBulgariaBurkina FasoBurundiCabo VerdeCambodiaCameroonCanadaCaribbean small statesCentral African RepublicCentral Europe and the BalticsChadChannel IslandsChileChinaColombiaComorosCongo, Dem. Rep.Congo, Rep.Costa RicaCote d'IvoireCroatiaCubaCyprusCzech RepublicDenmarkDjiboutiDominicaDominican RepublicEarly-demographic dividendEast Asia & PacificEast Asia & Pacific (excluding high income)East Asia & Pacific (IDA & IBRD countries)EcuadorEgypt, Arab Rep.El SalvadorEquatorial GuineaEritreaEstoniaEthiopiaEuro areaEurope & Central AsiaEurope & Central Asia (excluding high income)Europe & Central Asia (IDA & IBRD countries)European UnionFaroe IslandsFijiFinlandFragile and conflict affected situationsFranceFrench PolynesiaGabonGambia, TheGeorgiaGermanyGhanaGreeceGreenlandGrenadaGuatemalaGuineaGuinea-BissauGuyanaHaitiHeavily indebted poor countries (HIPC)High incomeHondurasHong Kong SAR, ChinaHungaryIBRD onlyIcelandIDA & IBRD totalIDA blendIDA onlyIDA totalIndiaIndonesiaIran, Islamic Rep.IraqIrelandIsle of ManIsraelItalyJamaicaJapanJordanKazakhstanKenyaKiribatiKorea, Rep.KosovoKuwaitKyrgyz RepublicLao PDRLate-demographic dividendLatin America & Caribbean Latin America & Caribbean (excluding high income)Latin America & the Caribbean (IDA & IBRD countries)LatviaLeast developed countries: UN classificationLebanonLesothoLiberiaLibyaLiechtensteinLithuaniaLow & middle incomeLow incomeLower middle incomeLuxembourgMacao SAR, ChinaMacedonia, FYRMadagascarMalawiMalaysiaMaldivesMaliMaltaMarshall IslandsMauritaniaMauritiusMexicoMicronesia, Fed. Sts.Middle East & North AfricaMiddle East & North Africa (excluding high income)Middle East & North Africa (IDA & IBRD countries)Middle incomeMoldovaMonacoMongoliaMontenegroMoroccoMozambiqueMyanmarNamibiaNepalNetherlandsNew CaledoniaNew ZealandNicaraguaNigerNigeriaNorth AmericaNorwayOECD membersOmanOther small statesPacific island small statesPakistanPalauPanamaPapua New GuineaParaguayPeruPhilippinesPolandPortugalPost-demographic dividendPre-demographic dividendPuerto RicoQatarRomaniaRussian FederationRwandaSamoaSan MarinoSao Tome and PrincipeSaudi ArabiaSenegalSerbiaSeychellesSierra LeoneSingaporeSlovak RepublicSloveniaSmall statesSolomon IslandsSomaliaSouth AfricaSouth AsiaSouth Asia (IDA & IBRD)South SudanSpainSri LankaSt. Kitts and NevisSt. LuciaSt. Vincent and the GrenadinesSub-Saharan Africa Sub-Saharan Africa (excluding high income)Sub-Saharan Africa (IDA & IBRD countries)SudanSurinameSwazilandSwedenSwitzerlandSyrian Arab RepublicTajikistanTanzaniaThailandTimor-LesteTogoTongaTrinidad and TobagoTunisiaTurkeyTurkmenistanTuvaluUgandaUkraineUnited Arab EmiratesUnited KingdomUnited StatesUpper middle incomeUruguayUzbekistanVanuatuVenezuela, RBVietnamVirgin Islands (U.S.)West Bank and GazaWorldYemen, Rep.ZambiaZimbabwe La ligne de temps
Cette échelle de temps montre un graphique de 1971 année à 2015 année Finland. Les données jusqu'à 1970 année ne sont pas présentés. Quantité d'observations actuelles selon dates: 45.
Source (désignation):
Les indicateurs du développement mondiale
Source (organisation):
World Bank staff estimates based on sources and methods in World Bank's "The Changing Wealth of Nations: Measuring Sustainable Development in the New Millennium" (2011).
Catégories:
Economy & Growth, Energy & Mining, Environment
Dernière mise à jour
23 avr. 2017
Les indicateurs de changement de valeurs selon les années
Minimum:
0.004
1 janv. 1999
Maximum:
0.368
1 janv. 2012
Pour la date d''observation
Valeur
Changement absolu
Le changement par rapport à la valeur précédente
1 janv. 1971
0.188
+0.188
0.0%
1 janv. 1972
0.105
-0.082
-43.84%
1 janv. 1973
0.104
-0.001
-1.19%
1 janv. 1974
0.219
+0.115
110.38%
1 janv. 1975
0.22
+0.001
0.48%
1 janv. 1976
0.062
-0.158
-71.79%
1 janv. 1977
0.079
+0.017
27.81%
1 janv. 1978
0.062
-0.017
-21.52%
1 janv. 1979
0.037
-0.025
-40.64%
1 janv. 1980
0.065
+0.028
74.46%
1 janv. 1981
0.075
+0.011
16.43%
1 janv. 1982
0.041
-0.034
-45.08%
1 janv. 1983
0.029
-0.013
-30.78%
1 janv. 1984
0.034
+0.005
18.89%
1 janv. 1985
0.021
-0.013
-39.32%
1 janv. 1986
0.018
-0.003
-12.59%
1 janv. 1987
0.008
-0.01
-54.4%
1 janv. 1988
0.009
+0.001
6.16%
1 janv. 1989
0.027
+0.019
213.43%
1 janv. 1990
0.069
+0.041
151.13%
1 janv. 1991
0.024
-0.044
-64.56%
1 janv. 1992
0.014
-0.01
-40.42%
1 janv. 1993
0.007
-0.007
-50.45%
1 janv. 1994
0.004
-0.003
-38.11%
1 janv. 1995
0.009
+0.005
108.33%
1 janv. 1996
0.009
-0.001
-8.12%
1 janv. 1997
0.007
-0.002
-21.72%
1 janv. 1998
0.005
-0.002
-23.34%
1 janv. 1999
0.004
-0.002
-29.71%
1 janv. 2000
0.004
+0.0
7.64%
1 janv. 2001
0.01
+0.006
157.54%
1 janv. 2002
0.005
-0.005
-54.07%
1 janv. 2003
0.007
+0.002
46.62%
1 janv. 2004
0.011
+0.004
63.41%
1 janv. 2005
0.021
+0.01
92.71%
1 janv. 2006
0.023
+0.002
9.02%
1 janv. 2007
0.065
+0.042
183.05%
1 janv. 2008
0.077
+0.012
18.95%
1 janv. 2009
0.211
+0.134
173.06%
1 janv. 2010
0.069
-0.142
-67.25%
1 janv. 2011
0.21
+0.141
203.01%
1 janv. 2012
0.368
+0.159
75.59%
1 janv. 2013
0.301
-0.067
-18.18%
1 janv. 2014
0.191
-0.11
-36.47%
1 janv. 2015
0.212
+0.02
10.64%
Classement des pays selon les statistiques actuelles par années


Commentaires: