29
/fr/
fr
AIzaSyAYiBZKx7MnpbEhh9jyipgxe19OcubqV5w
April 1, 2024
44025
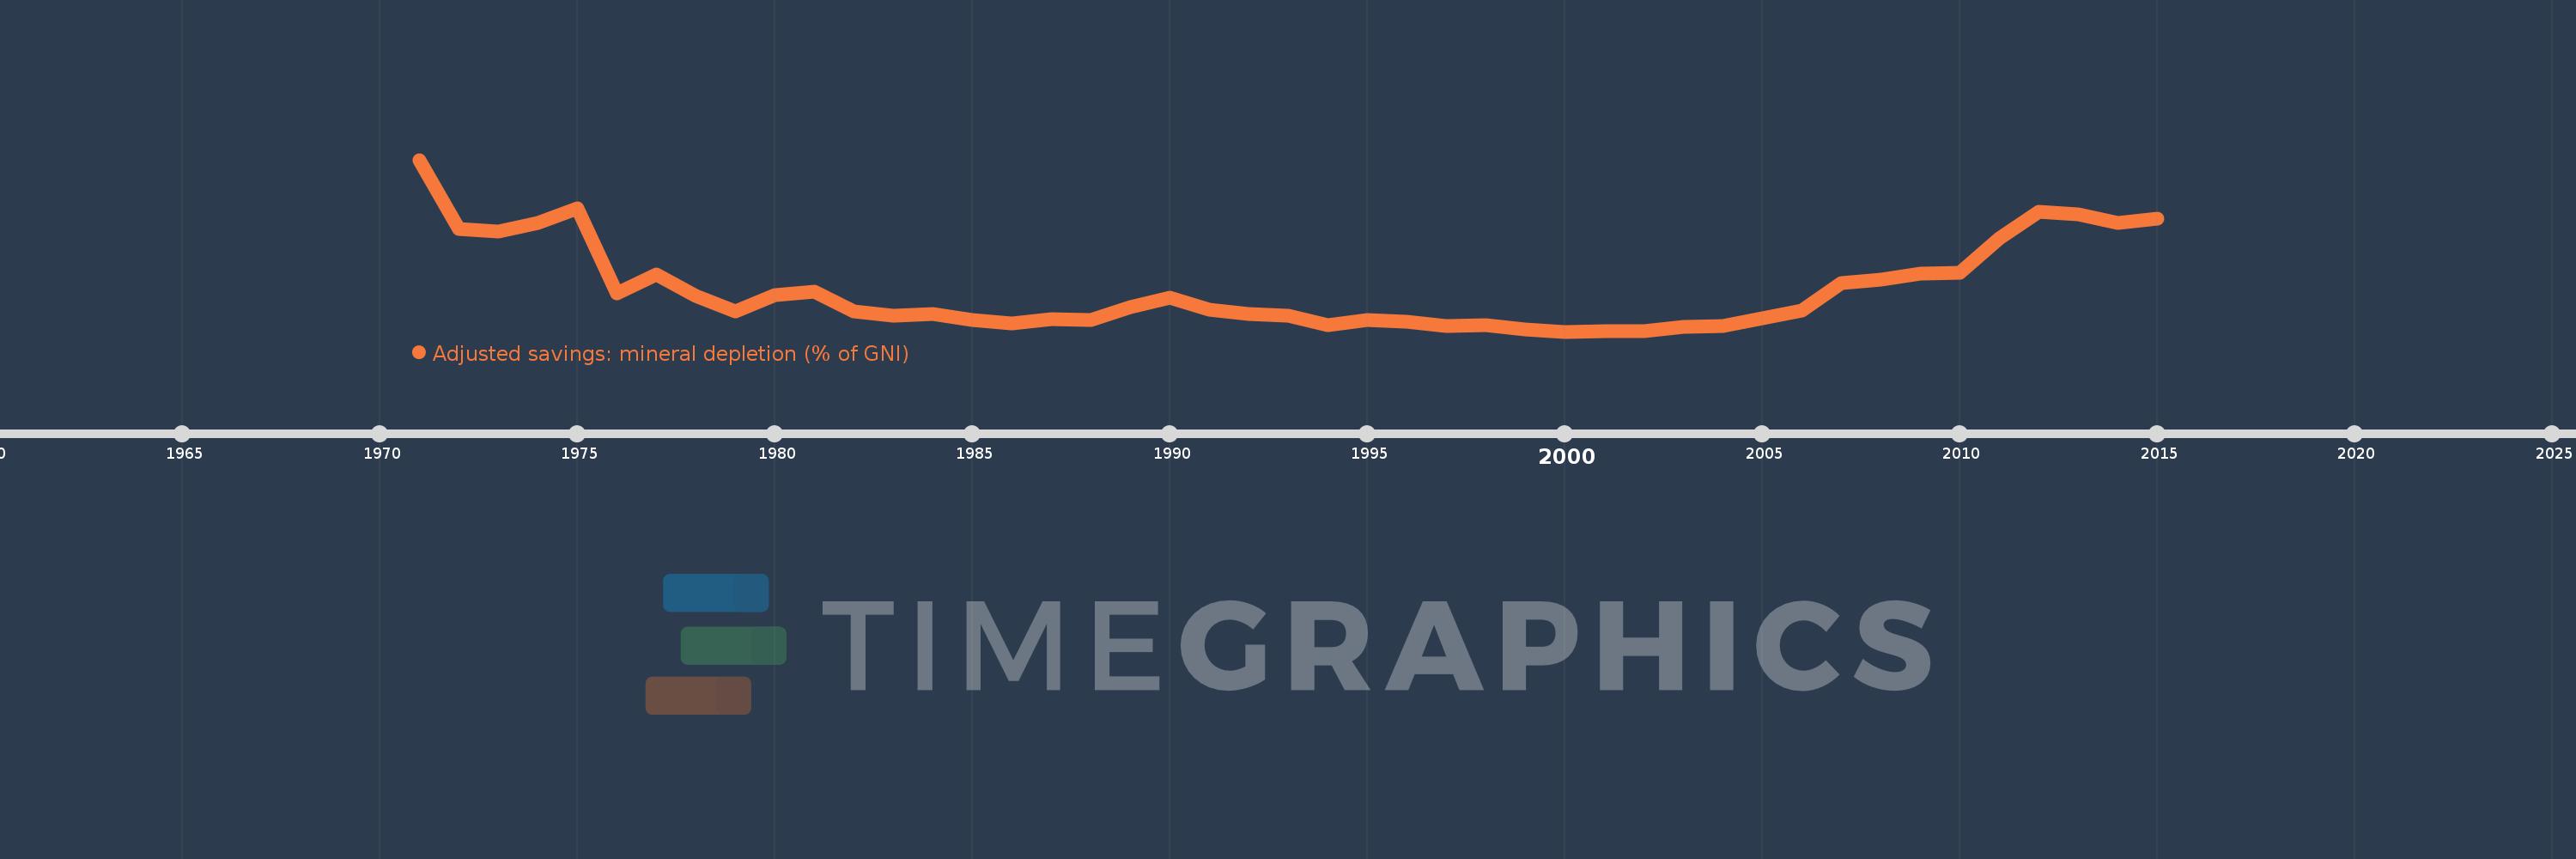
Least developed countries: UN classification
LDC
false
2
1
Adjusted savings: mineral depletion (% of GNI)
2015,2014,2013,2012,2011,2010,2009,2008,2007,2006,2005,2004,2003,2002,2001,2000,1999,1998,1997,1996,1995,1994,1993,1992,1991,1990,1989,1988,1987,1986,1985,1984,1983,1982,1981,1980,1979,1978,1977,1976,1975,1974,1973,1972,1971
Cette statistique dans les autres pays:
AfghanistanAlbaniaAlgeriaAmerican SamoaAndorraAngolaAntigua and BarbudaArab WorldArgentinaArmeniaAustraliaAustriaAzerbaijanBahamas, TheBahrainBangladeshBarbadosBelarusBelgiumBelizeBeninBermudaBhutanBoliviaBosnia and HerzegovinaBotswanaBrazilBrunei DarussalamBulgariaBurkina FasoBurundiCabo VerdeCambodiaCameroonCanadaCaribbean small statesCentral African RepublicCentral Europe and the BalticsChadChannel IslandsChileChinaColombiaComorosCongo, Dem. Rep.Congo, Rep.Costa RicaCote d'IvoireCroatiaCubaCyprusCzech RepublicDenmarkDjiboutiDominicaDominican RepublicEarly-demographic dividendEast Asia & PacificEast Asia & Pacific (excluding high income)East Asia & Pacific (IDA & IBRD countries)EcuadorEgypt, Arab Rep.El SalvadorEquatorial GuineaEritreaEstoniaEthiopiaEuro areaEurope & Central AsiaEurope & Central Asia (excluding high income)Europe & Central Asia (IDA & IBRD countries)European UnionFaroe IslandsFijiFinlandFragile and conflict affected situationsFranceFrench PolynesiaGabonGambia, TheGeorgiaGermanyGhanaGreeceGreenlandGrenadaGuatemalaGuineaGuinea-BissauGuyanaHaitiHeavily indebted poor countries (HIPC)High incomeHondurasHong Kong SAR, ChinaHungaryIBRD onlyIcelandIDA & IBRD totalIDA blendIDA onlyIDA totalIndiaIndonesiaIran, Islamic Rep.IraqIrelandIsle of ManIsraelItalyJamaicaJapanJordanKazakhstanKenyaKiribatiKorea, Rep.KosovoKuwaitKyrgyz RepublicLao PDRLate-demographic dividendLatin America & Caribbean Latin America & Caribbean (excluding high income)Latin America & the Caribbean (IDA & IBRD countries)LatviaLeast developed countries: UN classificationLebanonLesothoLiberiaLibyaLiechtensteinLithuaniaLow & middle incomeLow incomeLower middle incomeLuxembourgMacao SAR, ChinaMacedonia, FYRMadagascarMalawiMalaysiaMaldivesMaliMaltaMarshall IslandsMauritaniaMauritiusMexicoMicronesia, Fed. Sts.Middle East & North AfricaMiddle East & North Africa (excluding high income)Middle East & North Africa (IDA & IBRD countries)Middle incomeMoldovaMonacoMongoliaMontenegroMoroccoMozambiqueMyanmarNamibiaNepalNetherlandsNew CaledoniaNew ZealandNicaraguaNigerNigeriaNorth AmericaNorwayOECD membersOmanOther small statesPacific island small statesPakistanPalauPanamaPapua New GuineaParaguayPeruPhilippinesPolandPortugalPost-demographic dividendPre-demographic dividendPuerto RicoQatarRomaniaRussian FederationRwandaSamoaSan MarinoSao Tome and PrincipeSaudi ArabiaSenegalSerbiaSeychellesSierra LeoneSingaporeSlovak RepublicSloveniaSmall statesSolomon IslandsSomaliaSouth AfricaSouth AsiaSouth Asia (IDA & IBRD)South SudanSpainSri LankaSt. Kitts and NevisSt. LuciaSt. Vincent and the GrenadinesSub-Saharan Africa Sub-Saharan Africa (excluding high income)Sub-Saharan Africa (IDA & IBRD countries)SudanSurinameSwazilandSwedenSwitzerlandSyrian Arab RepublicTajikistanTanzaniaThailandTimor-LesteTogoTongaTrinidad and TobagoTunisiaTurkeyTurkmenistanTuvaluUgandaUkraineUnited Arab EmiratesUnited KingdomUnited StatesUpper middle incomeUruguayUzbekistanVanuatuVenezuela, RBVietnamVirgin Islands (U.S.)West Bank and GazaWorldYemen, Rep.ZambiaZimbabwe La ligne de temps
Cette échelle de temps montre un graphique de 1971 année à 2015 année Least developed countries: UN classification. Les données jusqu'à 1970 année ne sont pas présentés. Quantité d'observations actuelles selon dates: 45.
Source (désignation):
Les indicateurs du développement mondiale
Source (organisation):
World Bank staff estimates based on sources and methods in World Bank's "The Changing Wealth of Nations: Measuring Sustainable Development in the New Millennium" (2011).
Catégories:
Economy & Growth, Energy & Mining, Environment
Dernière mise à jour
23 avr. 2017
Les indicateurs de changement de valeurs selon les années
Minimum:
0.084
1 janv. 2000
Maximum:
2.563
1 janv. 1971
Pour la date d''observation
Valeur
Changement absolu
Le changement par rapport à la valeur précédente
1 janv. 1971
2.563
+2.563
0.0%
1 janv. 1972
1.567
-0.996
-38.86%
1 janv. 1973
1.529
-0.038
-2.41%
1 janv. 1974
1.65
+0.121
7.94%
1 janv. 1975
1.862
+0.212
12.84%
1 janv. 1976
0.633
-1.229
-66.01%
1 janv. 1977
0.903
+0.27
42.63%
1 janv. 1978
0.603
-0.3
-33.2%
1 janv. 1979
0.379
-0.224
-37.16%
1 janv. 1980
0.61
+0.231
60.88%
1 janv. 1981
0.658
+0.048
7.95%
1 janv. 1982
0.371
-0.287
-43.59%
1 janv. 1983
0.312
-0.059
-16.0%
1 janv. 1984
0.335
+0.023
7.46%
1 janv. 1985
0.251
-0.084
-25.14%
1 janv. 1986
0.205
-0.046
-18.48%
1 janv. 1987
0.264
+0.06
29.22%
1 janv. 1988
0.255
-0.009
-3.45%
1 janv. 1989
0.435
+0.18
70.43%
1 janv. 1990
0.57
+0.135
31.0%
1 janv. 1991
0.403
-0.167
-29.24%
1 janv. 1992
0.34
-0.063
-15.67%
1 janv. 1993
0.313
-0.027
-7.81%
1 janv. 1994
0.179
-0.134
-42.79%
1 janv. 1995
0.246
+0.066
37.03%
1 janv. 1996
0.225
-0.021
-8.45%
1 janv. 1997
0.161
-0.064
-28.34%
1 janv. 1998
0.172
+0.011
7.0%
1 janv. 1999
0.109
-0.064
-36.9%
1 janv. 2000
0.084
-0.025
-23.22%
1 janv. 2001
0.095
+0.012
13.83%
1 janv. 2002
0.09
-0.005
-5.0%
1 janv. 2003
0.148
+0.058
64.02%
1 janv. 2004
0.166
+0.018
12.27%
1 janv. 2005
0.275
+0.109
65.3%
1 janv. 2006
0.39
+0.115
41.75%
1 janv. 2007
0.785
+0.395
101.27%
1 janv. 2008
0.83
+0.046
5.82%
1 janv. 2009
0.922
+0.091
11.0%
1 janv. 2010
0.939
+0.017
1.84%
1 janv. 2011
1.432
+0.494
52.57%
1 janv. 2012
1.809
+0.376
26.27%
1 janv. 2013
1.779
-0.029
-1.63%
1 janv. 2014
1.65
-0.129
-7.24%
1 janv. 2015
1.72
+0.069
4.2%
Classement des pays selon les statistiques actuelles par années


Commentaires: