29
/fr/
fr
AIzaSyAYiBZKx7MnpbEhh9jyipgxe19OcubqV5w
April 1, 2024
69017
Antigua and Barbuda
ATG
true
2
1
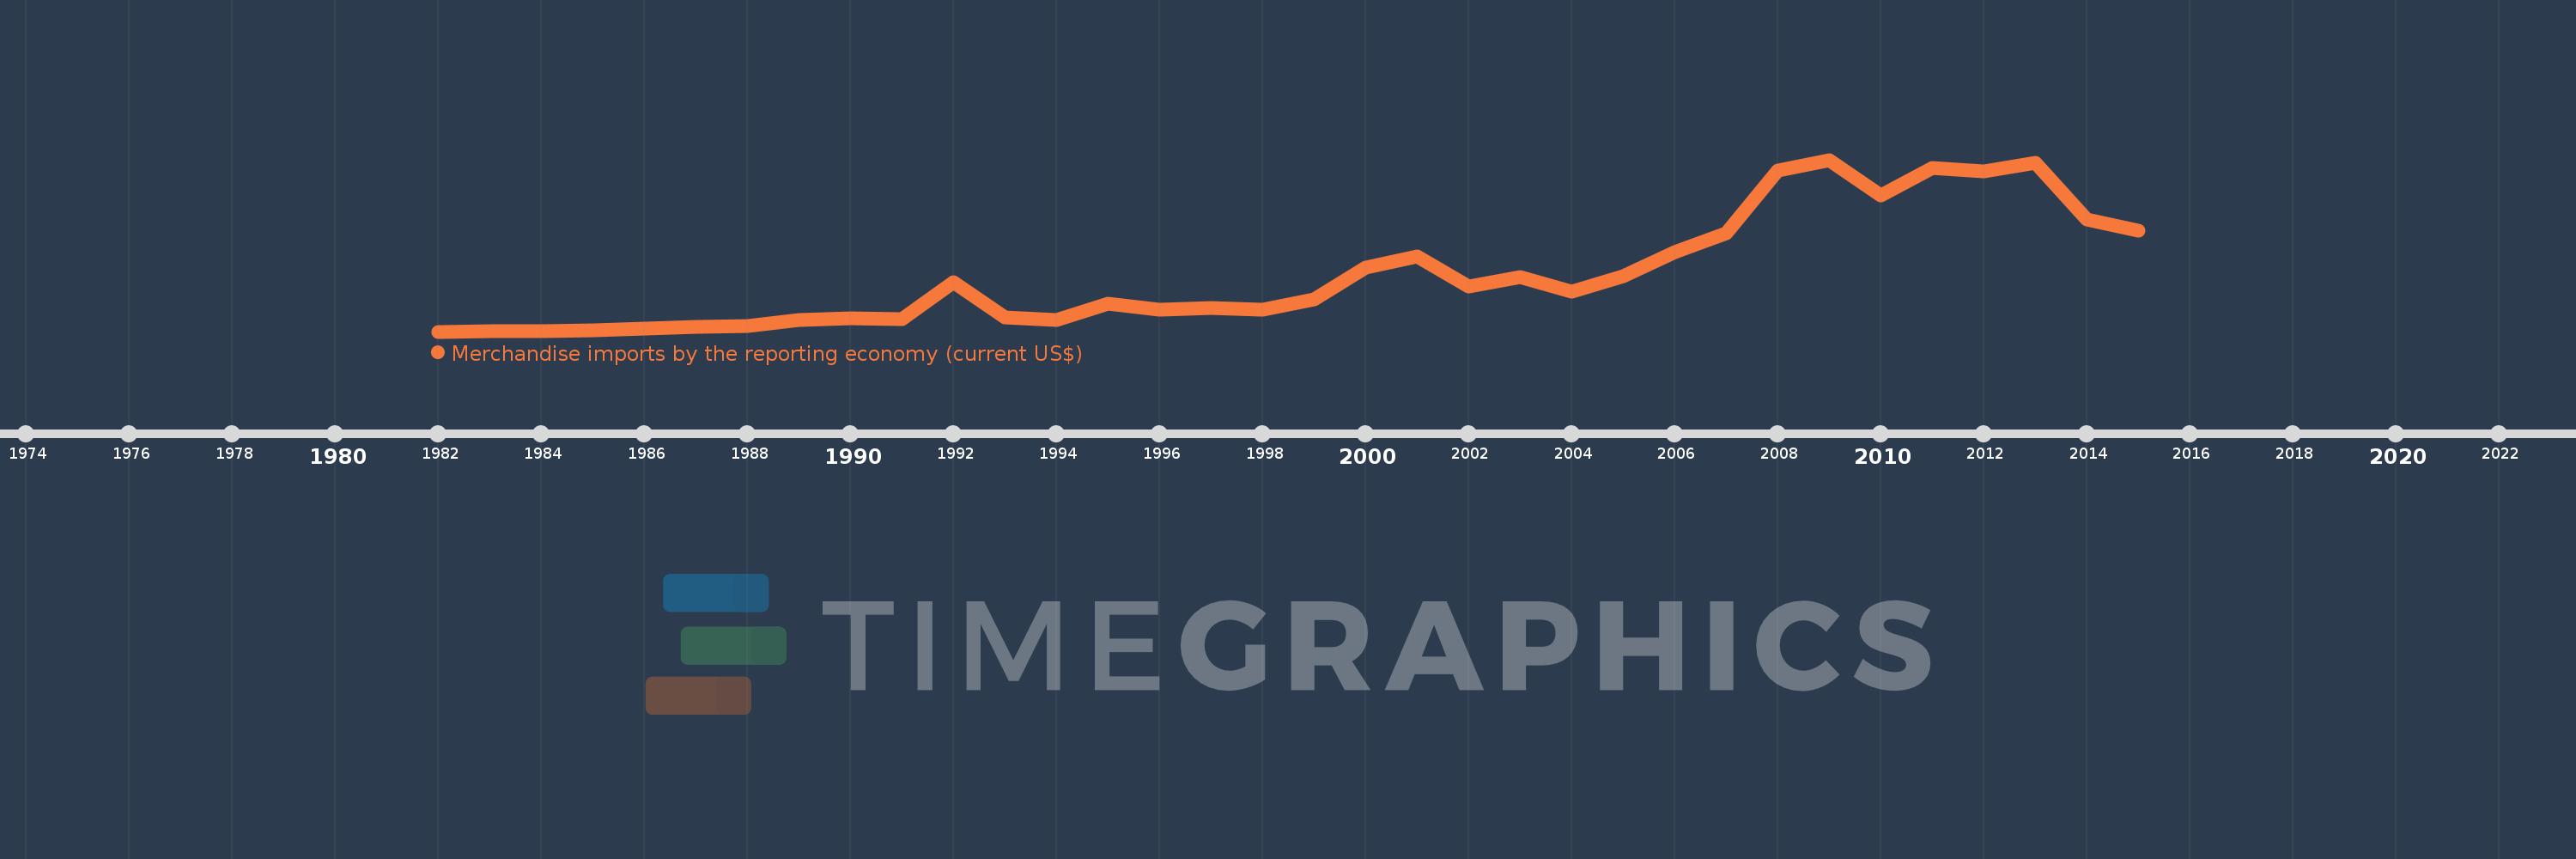
Merchandise imports by the reporting economy (current US$)
2015,2014,2013,2012,2011,2010,2009,2008,2007,2006,2005,2004,2003,2002,2001,2000,1999,1998,1997,1996,1995,1994,1993,1992,1991,1990,1989,1988,1987,1986,1985,1984,1983,1982
Cette statistique dans les autres pays:
AfghanistanAlbaniaAlgeriaAmerican SamoaAngolaAntigua and BarbudaArab WorldArgentinaArmeniaArubaAustraliaAustriaAzerbaijanBahamas, TheBahrainBangladeshBarbadosBelarusBelgiumBelizeBeninBermudaBoliviaBosnia and HerzegovinaBrazilBrunei DarussalamBulgariaBurkina FasoBurundiCabo VerdeCambodiaCameroonCanadaCaribbean small statesCentral African RepublicCentral Europe and the BalticsChadChileChinaColombiaComorosCongo, Dem. Rep.Congo, Rep.Costa RicaCote d'IvoireCroatiaCubaCyprusCzech RepublicDenmarkDjiboutiDominicaDominican RepublicEarly-demographic dividendEast Asia & PacificEast Asia & Pacific (excluding high income)East Asia & Pacific (IDA & IBRD countries)EcuadorEgypt, Arab Rep.El SalvadorEquatorial GuineaEstoniaEthiopiaEuro areaEurope & Central AsiaEurope & Central Asia (excluding high income)Europe & Central Asia (IDA & IBRD countries)European UnionFaroe IslandsFijiFinlandFragile and conflict affected situationsFranceFrench PolynesiaGabonGambia, TheGeorgiaGermanyGhanaGibraltarGreeceGreenlandGrenadaGuamGuatemalaGuineaGuinea-BissauGuyanaHaitiHeavily indebted poor countries (HIPC)High incomeHondurasHong Kong SAR, ChinaHungaryIBRD onlyIcelandIDA & IBRD totalIDA blendIDA onlyIDA totalIndiaIndonesiaIran, Islamic Rep.IraqIrelandIsraelItalyJamaicaJapanJordanKazakhstanKenyaKiribatiKorea, Dem. People’s Rep.Korea, Rep.KosovoKuwaitKyrgyz RepublicLao PDRLate-demographic dividendLatin America & Caribbean Latin America & Caribbean (excluding high income)Latin America & the Caribbean (IDA & IBRD countries)LatviaLeast developed countries: UN classificationLebanonLiberiaLibyaLithuaniaLow & middle incomeLow incomeLower middle incomeLuxembourgMacao SAR, ChinaMacedonia, FYRMadagascarMalawiMalaysiaMaldivesMaliMaltaMauritaniaMauritiusMexicoMiddle East & North AfricaMiddle East & North Africa (excluding high income)Middle East & North Africa (IDA & IBRD countries)Middle incomeMoldovaMongoliaMontenegroMoroccoMozambiqueMyanmarNauruNepalNetherlandsNew CaledoniaNew ZealandNicaraguaNigerNigeriaNorth AmericaNorwayOECD membersOmanOther small statesPacific island small statesPakistanPanamaPapua New GuineaParaguayPeruPhilippinesPolandPortugalPost-demographic dividendPre-demographic dividendQatarRomaniaRussian FederationRwandaSamoaSao Tome and PrincipeSaudi ArabiaSenegalSerbiaSeychellesSierra LeoneSingaporeSlovak RepublicSloveniaSmall statesSolomon IslandsSomaliaSouth AfricaSouth AsiaSouth Asia (IDA & IBRD)SpainSri LankaSt. Kitts and NevisSt. LuciaSt. Vincent and the GrenadinesSub-Saharan Africa Sub-Saharan Africa (excluding high income)Sub-Saharan Africa (IDA & IBRD countries)SudanSurinameSwedenSwitzerlandSyrian Arab RepublicTajikistanTanzaniaThailandTogoTongaTrinidad and TobagoTunisiaTurkeyTurkmenistanTuvaluUgandaUkraineUnited Arab EmiratesUnited KingdomUnited StatesUpper middle incomeUruguayUzbekistanVanuatuVenezuela, RBVietnamWorldYemen, Rep.ZambiaZimbabwe La ligne de temps
Cette échelle de temps montre un graphique de 1982 année à 2015 année Antigua and Barbuda. Les données jusqu'à 1981 année ne sont pas présentés. Quantité d'observations actuelles selon dates: 34.
Source (désignation):
Les indicateurs du développement mondiale
Source (organisation):
World Bank staff estimates based data from International Monetary Fund's Direction of Trade database.
Catégories:
Private Sector, Trade
Dernière mise à jour
23 avr. 2017
Les indicateurs de changement de valeurs selon les années
Minimum:
21.661 mln.
1 janv. 1982
Maximum:
2.151 mds
1 janv. 2009
Pour la date d''observation
Valeur
Changement absolu
Le changement par rapport à la valeur précédente
1 janv. 1982
21.661 mln.
+21.661 mln.
0.0%
1 janv. 1983
30.47 mln.
+8.809 mln.
40.67%
1 janv. 1984
26.352 mln.
-4.118 mln.
-13.51%
1 janv. 1985
42.295 mln.
+15.943 mln.
60.5%
1 janv. 1986
55.126 mln.
+12.831 mln.
30.34%
1 janv. 1987
82.449 mln.
+27.323 mln.
49.56%
1 janv. 1988
94.141 mln.
+11.692 mln.
14.18%
1 janv. 1989
167.825 mln.
+73.685 mln.
78.27%
1 janv. 1990
189.75 mln.
+21.924 mln.
13.06%
1 janv. 1991
175.498 mln.
-14.251 mln.
-7.51%
1 janv. 1992
629.21 mln.
+453.711 mln.
258.53%
1 janv. 1993
196.085 mln.
-433.124 mln.
-68.84%
1 janv. 1994
168.019 mln.
-28.066 mln.
-14.31%
1 janv. 1995
363.383 mln.
+195.364 mln.
116.28%
1 janv. 1996
298.195 mln.
-65.189 mln.
-17.94%
1 janv. 1997
317.984 mln.
+19.789 mln.
6.64%
1 janv. 1998
296.439 mln.
-21.545 mln.
-6.78%
1 janv. 1999
416.47 mln.
+120.031 mln.
40.49%
1 janv. 2000
818.11 mln.
+401.64 mln.
96.44%
1 janv. 2001
949.567 mln.
+131.458 mln.
16.07%
1 janv. 2002
584.106 mln.
-365.461 mln.
-38.49%
1 janv. 2003
693.709 mln.
+109.603 mln.
18.76%
1 janv. 2004
520.731 mln.
-172.978 mln.
-24.94%
1 janv. 2005
706.896 mln.
+186.165 mln.
35.75%
1 janv. 2006
1.006 mds
+299.539 mln.
42.37%
1 janv. 2007
1.24 mds
+233.828 mln.
23.23%
1 janv. 2008
2.018 mds
+777.896 mln.
62.72%
1 janv. 2009
2.151 mds
+132.847 mln.
6.58%
1 janv. 2010
1.712 mds
-439.434 mln.
-20.43%
1 janv. 2011
2.05 mds
+338.277 mln.
19.76%
1 janv. 2012
2.005 mds
-44.829 mln.
-2.19%
1 janv. 2013
2.11 mds
+104.943 mln.
5.23%
1 janv. 2014
1.411 mds
-698.727 mln.
-33.12%
1 janv. 2015
1.27 mds
-141.472 mln.
-10.02%
Classement des pays selon les statistiques actuelles par années


Commentaires: