29
/fr/
fr
AIzaSyAYiBZKx7MnpbEhh9jyipgxe19OcubqV5w
April 1, 2024
105146
Chile
CHL
true
2
1
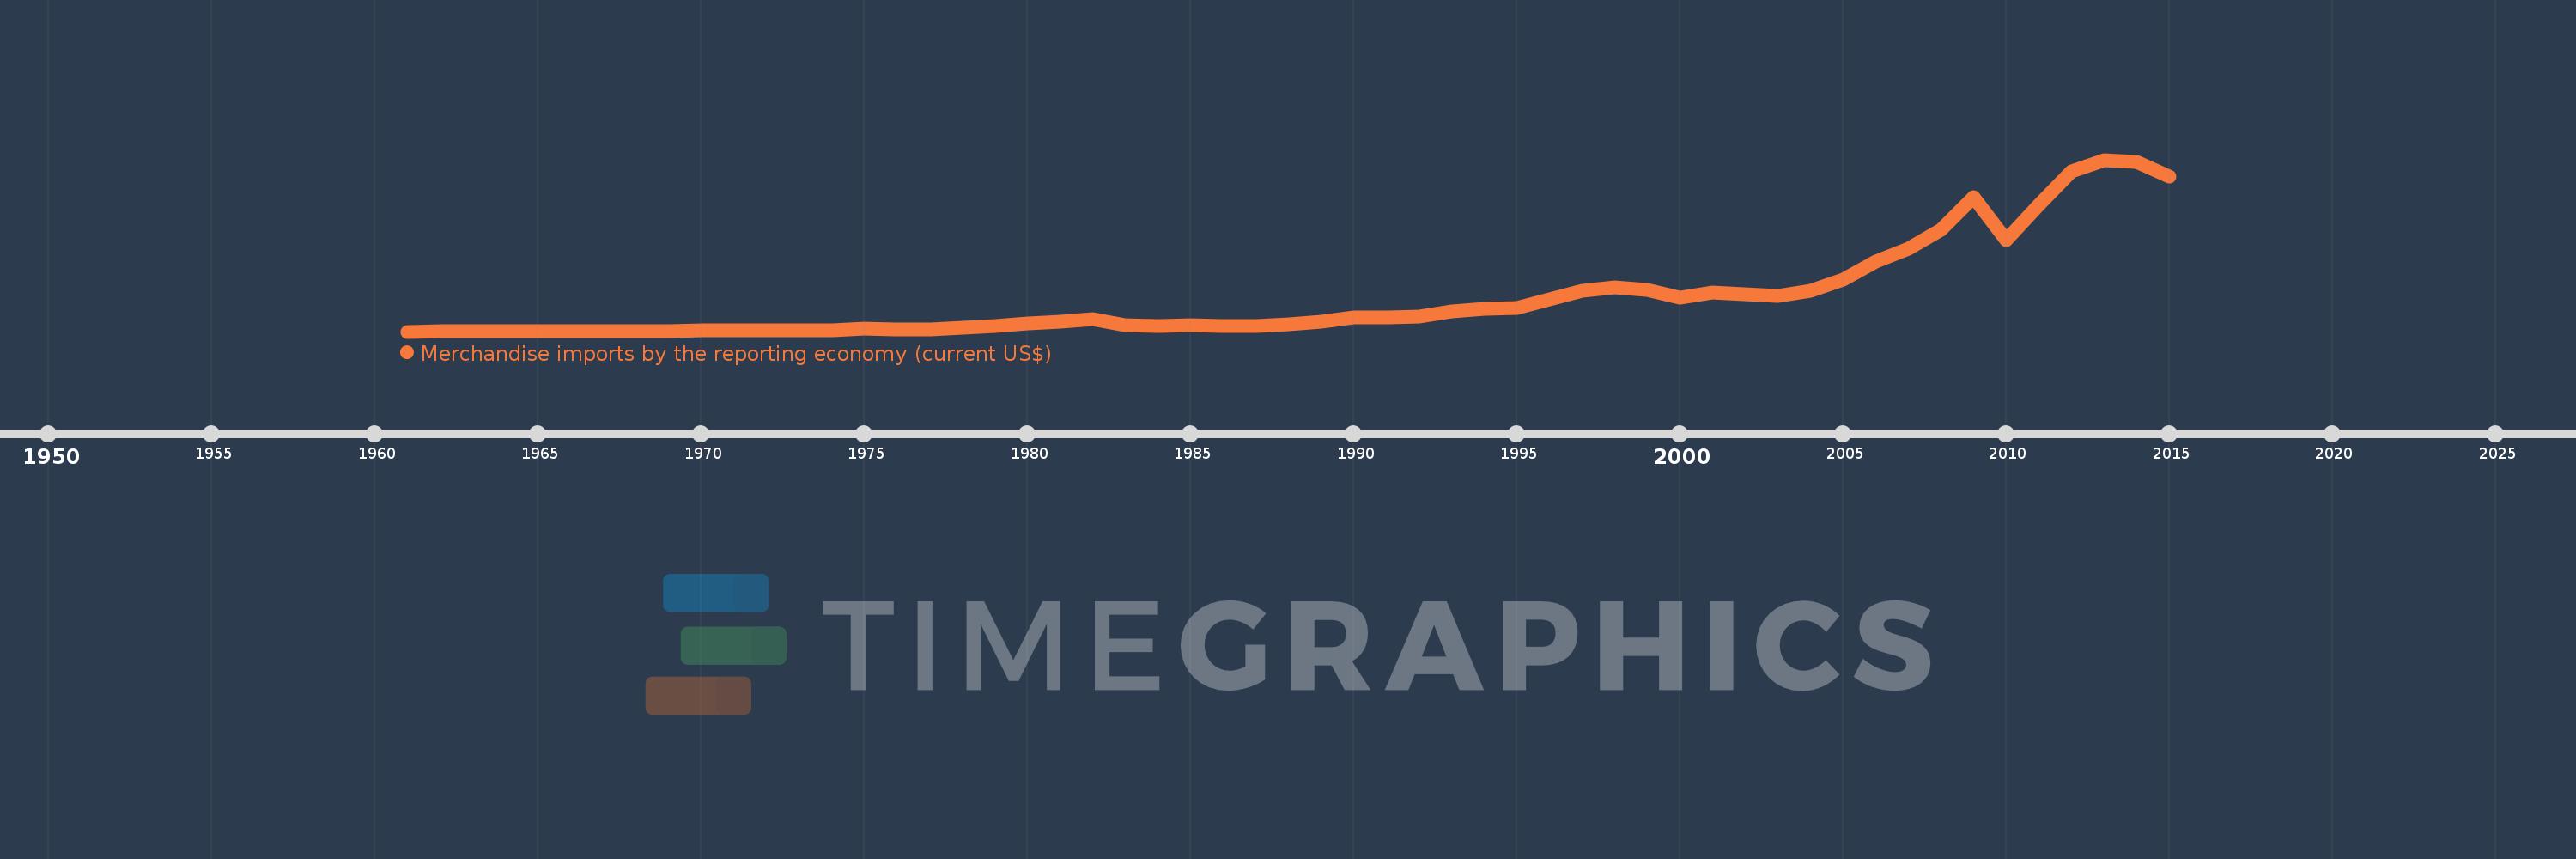
Merchandise imports by the reporting economy (current US$)
2015,2014,2013,2012,2011,2010,2009,2008,2007,2006,2005,2004,2003,2002,2001,2000,1999,1998,1997,1996,1995,1994,1993,1992,1991,1990,1989,1988,1987,1986,1985,1984,1983,1982,1981,1980,1979,1978,1977,1976,1975,1974,1973,1972,1971,1970,1969,1968,1967,1966,1965,1964,1963,1962,1961
Cette statistique dans les autres pays:
AfghanistanAlbaniaAlgeriaAmerican SamoaAngolaAntigua and BarbudaArab WorldArgentinaArmeniaArubaAustraliaAustriaAzerbaijanBahamas, TheBahrainBangladeshBarbadosBelarusBelgiumBelizeBeninBermudaBoliviaBosnia and HerzegovinaBrazilBrunei DarussalamBulgariaBurkina FasoBurundiCabo VerdeCambodiaCameroonCanadaCaribbean small statesCentral African RepublicCentral Europe and the BalticsChadChileChinaColombiaComorosCongo, Dem. Rep.Congo, Rep.Costa RicaCote d'IvoireCroatiaCubaCyprusCzech RepublicDenmarkDjiboutiDominicaDominican RepublicEarly-demographic dividendEast Asia & PacificEast Asia & Pacific (excluding high income)East Asia & Pacific (IDA & IBRD countries)EcuadorEgypt, Arab Rep.El SalvadorEquatorial GuineaEstoniaEthiopiaEuro areaEurope & Central AsiaEurope & Central Asia (excluding high income)Europe & Central Asia (IDA & IBRD countries)European UnionFaroe IslandsFijiFinlandFragile and conflict affected situationsFranceFrench PolynesiaGabonGambia, TheGeorgiaGermanyGhanaGibraltarGreeceGreenlandGrenadaGuamGuatemalaGuineaGuinea-BissauGuyanaHaitiHeavily indebted poor countries (HIPC)High incomeHondurasHong Kong SAR, ChinaHungaryIBRD onlyIcelandIDA & IBRD totalIDA blendIDA onlyIDA totalIndiaIndonesiaIran, Islamic Rep.IraqIrelandIsraelItalyJamaicaJapanJordanKazakhstanKenyaKiribatiKorea, Dem. People’s Rep.Korea, Rep.KosovoKuwaitKyrgyz RepublicLao PDRLate-demographic dividendLatin America & Caribbean Latin America & Caribbean (excluding high income)Latin America & the Caribbean (IDA & IBRD countries)LatviaLeast developed countries: UN classificationLebanonLiberiaLibyaLithuaniaLow & middle incomeLow incomeLower middle incomeLuxembourgMacao SAR, ChinaMacedonia, FYRMadagascarMalawiMalaysiaMaldivesMaliMaltaMauritaniaMauritiusMexicoMiddle East & North AfricaMiddle East & North Africa (excluding high income)Middle East & North Africa (IDA & IBRD countries)Middle incomeMoldovaMongoliaMontenegroMoroccoMozambiqueMyanmarNauruNepalNetherlandsNew CaledoniaNew ZealandNicaraguaNigerNigeriaNorth AmericaNorwayOECD membersOmanOther small statesPacific island small statesPakistanPanamaPapua New GuineaParaguayPeruPhilippinesPolandPortugalPost-demographic dividendPre-demographic dividendQatarRomaniaRussian FederationRwandaSamoaSao Tome and PrincipeSaudi ArabiaSenegalSerbiaSeychellesSierra LeoneSingaporeSlovak RepublicSloveniaSmall statesSolomon IslandsSomaliaSouth AfricaSouth AsiaSouth Asia (IDA & IBRD)SpainSri LankaSt. Kitts and NevisSt. LuciaSt. Vincent and the GrenadinesSub-Saharan Africa Sub-Saharan Africa (excluding high income)Sub-Saharan Africa (IDA & IBRD countries)SudanSurinameSwedenSwitzerlandSyrian Arab RepublicTajikistanTanzaniaThailandTogoTongaTrinidad and TobagoTunisiaTurkeyTurkmenistanTuvaluUgandaUkraineUnited Arab EmiratesUnited KingdomUnited StatesUpper middle incomeUruguayUzbekistanVanuatuVenezuela, RBVietnamWorldYemen, Rep.ZambiaZimbabwe La ligne de temps
Cette échelle de temps montre un graphique de 1961 année à 2015 année Chile. Les données jusqu'à 1960 année ne sont pas présentés. Quantité d'observations actuelles selon dates: 55.
Source (désignation):
Les indicateurs du développement mondiale
Source (organisation):
World Bank staff estimates based data from International Monetary Fund's Direction of Trade database.
Catégories:
Private Sector, Trade
Dernière mise à jour
23 avr. 2017
Les indicateurs de changement de valeurs selon les années
Minimum:
498.8 mln.
1 janv. 1961
Maximum:
80.079 mds
1 janv. 2013
Pour la date d''observation
Valeur
Changement absolu
Le changement par rapport à la valeur précédente
1 janv. 1961
498.8 mln.
+498.8 mln.
0.0%
1 janv. 1962
590.2 mln.
+91.4 mln.
18.32%
1 janv. 1963
511.3 mln.
-78.9 mln.
-13.37%
1 janv. 1964
637.1 mln.
+125.8 mln.
24.6%
1 janv. 1965
608.5 mln.
-28.6 mln.
-4.49%
1 janv. 1966
603.5 mln.
-5.0 mln.
-0.82%
1 janv. 1967
758.61 mln.
+155.11 mln.
25.7%
1 janv. 1968
735.19 mln.
-23.42 mln.
-3.09%
1 janv. 1969
742.74 mln.
+7.55 mln.
1.03%
1 janv. 1970
907.16 mln.
+164.42 mln.
22.14%
1 janv. 1971
930.82 mln.
+23.66 mln.
2.61%
1 janv. 1972
979.96 mln.
+49.14 mln.
5.28%
1 janv. 1973
941.13 mln.
-38.83 mln.
-3.96%
1 janv. 1974
1.098 mds
+156.47 mln.
16.63%
1 janv. 1975
1.911 mds
+813.86 mln.
74.15%
1 janv. 1976
1.534 mds
-376.98 mln.
-19.72%
1 janv. 1977
1.679 mds
+144.92 mln.
9.44%
1 janv. 1978
2.26 mds
+580.7 mln.
34.58%
1 janv. 1979
3.002 mds
+742.3 mln.
32.84%
1 janv. 1980
4.218 mds
+1.215 mds
40.47%
1 janv. 1981
5.136 mds
+918.2 mln.
21.77%
1 janv. 1982
6.371 mds
+1.235 mds
24.05%
1 janv. 1983
3.536 mds
-2.835 mds
-44.5%
1 janv. 1984
2.978 mds
-558.5 mln.
-15.79%
1 janv. 1985
3.495 mds
+517.9 mln.
17.39%
1 janv. 1986
3.088 mds
-407.5 mln.
-11.66%
1 janv. 1987
3.141 mds
+52.8 mln.
1.71%
1 janv. 1988
4.042 mds
+901.4 mln.
28.7%
1 janv. 1989
5.077 mds
+1.035 mds
25.61%
1 janv. 1990
6.984 mds
+1.906 mds
37.54%
1 janv. 1991
7.227 mds
+243.7 mln.
3.49%
1 janv. 1992
7.63 mds
+402.8 mln.
5.57%
1 janv. 1993
9.928 mds
+2.298 mds
30.12%
1 janv. 1994
10.968 mds
+1.04 mds
10.47%
1 janv. 1995
11.628 mds
+659.787 mln.
6.02%
1 janv. 1996
15.479 mds
+3.851 mds
33.12%
1 janv. 1997
19.526 mds
+4.047 mds
26.14%
1 janv. 1998
21.148 mds
+1.622 mds
8.31%
1 janv. 1999
19.872 mds
-1.276 mds
-6.03%
1 janv. 2000
16.059 mds
-3.812 mds
-19.19%
1 janv. 2001
18.535 mds
+2.475 mds
15.41%
1 janv. 2002
17.83 mds
-705.01 mln.
-3.8%
1 janv. 2003
17.014 mds
-816.16 mln.
-4.58%
1 janv. 2004
19.264 mds
+2.25 mds
13.23%
1 janv. 2005
24.727 mds
+5.463 mds
28.36%
1 janv. 2006
32.925 mds
+8.198 mds
33.15%
1 janv. 2007
38.978 mds
+6.053 mds
18.38%
1 janv. 2008
47.595 mds
+8.617 mds
22.11%
1 janv. 2009
62.787 mds
+15.192 mds
31.92%
1 janv. 2010
42.806 mds
-19.982 mds
-31.82%
1 janv. 2011
59.208 mds
+16.403 mds
38.32%
1 janv. 2012
74.696 mds
+15.487 mds
26.16%
1 janv. 2013
80.079 mds
+5.383 mds
7.21%
1 janv. 2014
79.266 mds
-812.549 mln.
-1.01%
1 janv. 2015
72.167 mds
-7.099 mds
-8.96%
Classement des pays selon les statistiques actuelles par années


Commentaires: