29
/fr/
fr
AIzaSyAYiBZKx7MnpbEhh9jyipgxe19OcubqV5w
April 1, 2024
183135
Macao SAR, China
MAC
true
2
1
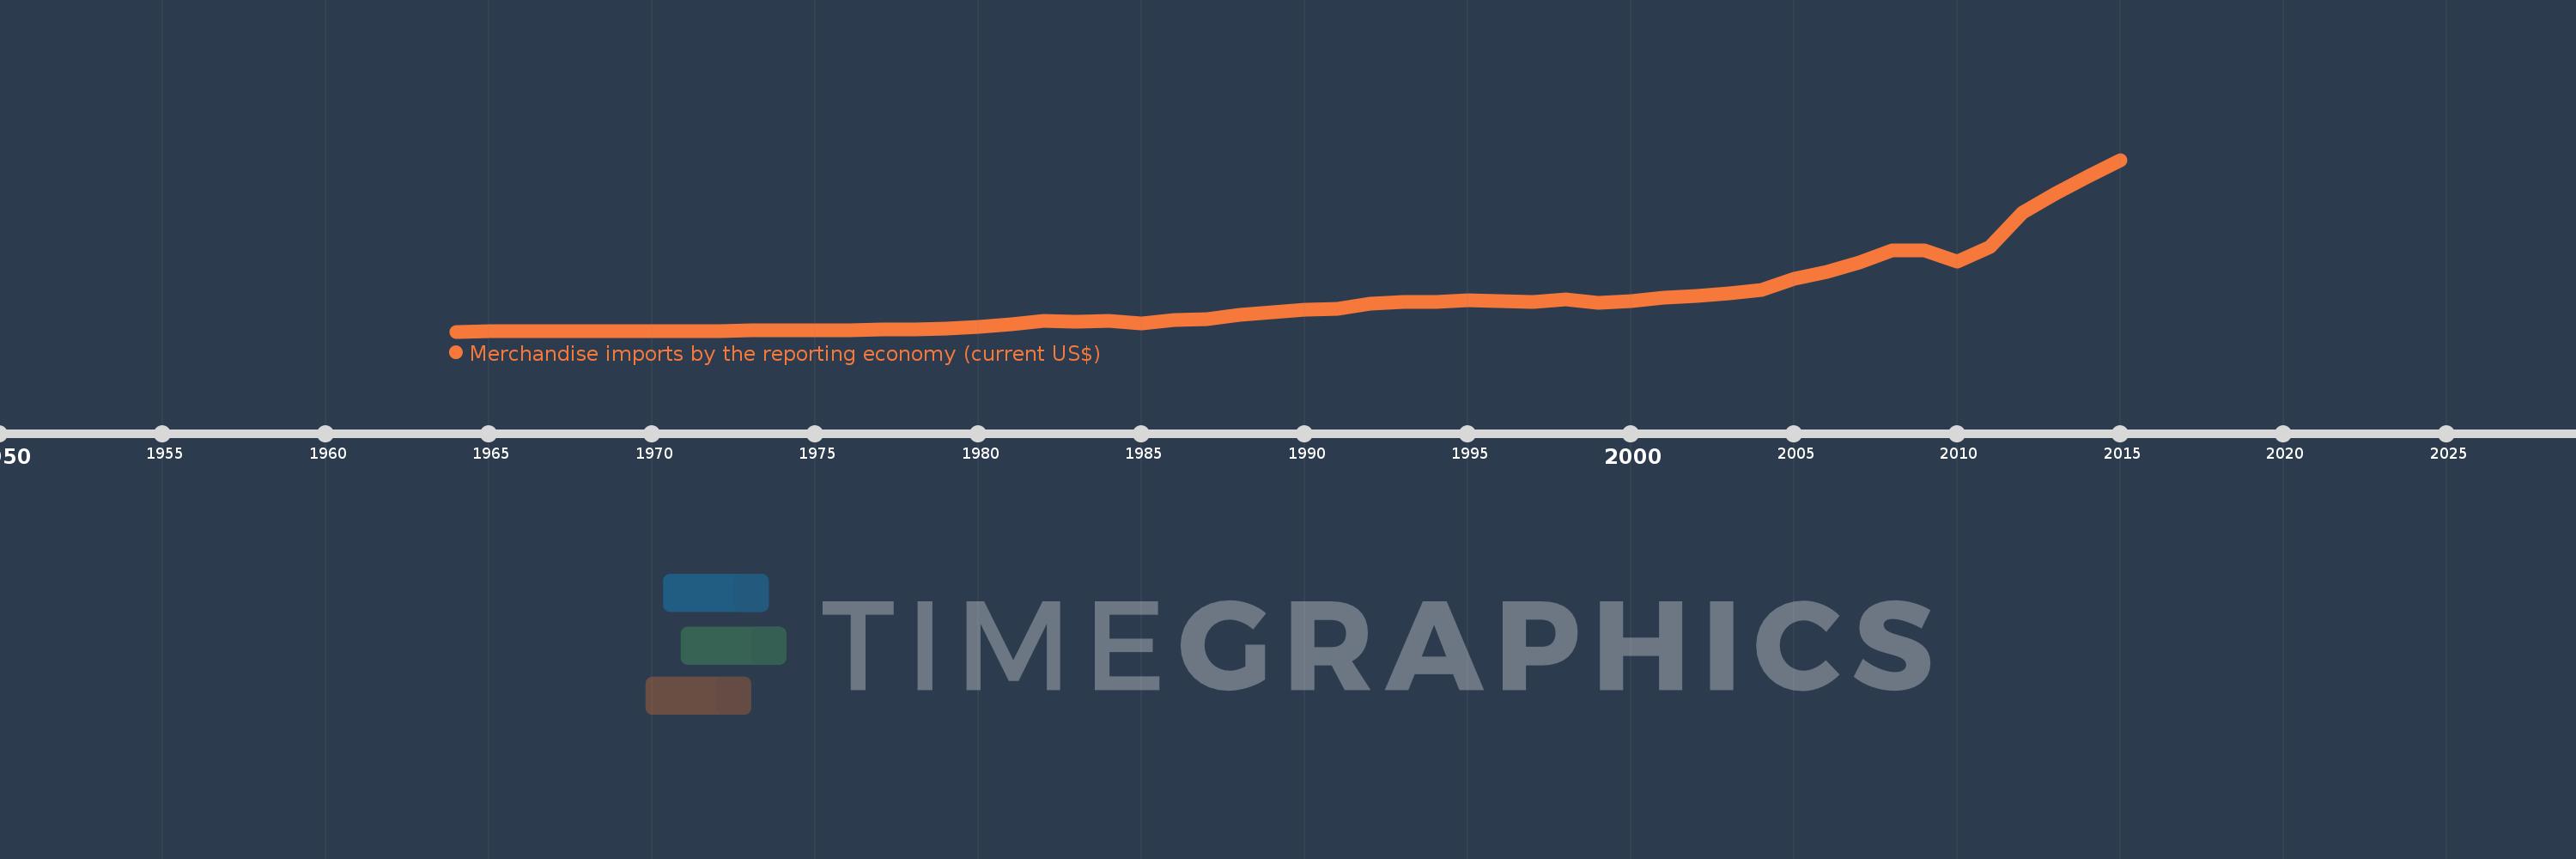
Merchandise imports by the reporting economy (current US$)
2015,2014,2013,2012,2011,2010,2009,2008,2007,2006,2005,2004,2003,2002,2001,2000,1999,1998,1997,1996,1995,1994,1993,1992,1991,1990,1989,1988,1987,1986,1985,1984,1983,1982,1981,1980,1979,1978,1977,1976,1975,1974,1973,1972,1971,1970,1968,1967,1966,1965,1964
Cette statistique dans les autres pays:
AfghanistanAlbaniaAlgeriaAmerican SamoaAngolaAntigua and BarbudaArab WorldArgentinaArmeniaArubaAustraliaAustriaAzerbaijanBahamas, TheBahrainBangladeshBarbadosBelarusBelgiumBelizeBeninBermudaBoliviaBosnia and HerzegovinaBrazilBrunei DarussalamBulgariaBurkina FasoBurundiCabo VerdeCambodiaCameroonCanadaCaribbean small statesCentral African RepublicCentral Europe and the BalticsChadChileChinaColombiaComorosCongo, Dem. Rep.Congo, Rep.Costa RicaCote d'IvoireCroatiaCubaCyprusCzech RepublicDenmarkDjiboutiDominicaDominican RepublicEarly-demographic dividendEast Asia & PacificEast Asia & Pacific (excluding high income)East Asia & Pacific (IDA & IBRD countries)EcuadorEgypt, Arab Rep.El SalvadorEquatorial GuineaEstoniaEthiopiaEuro areaEurope & Central AsiaEurope & Central Asia (excluding high income)Europe & Central Asia (IDA & IBRD countries)European UnionFaroe IslandsFijiFinlandFragile and conflict affected situationsFranceFrench PolynesiaGabonGambia, TheGeorgiaGermanyGhanaGibraltarGreeceGreenlandGrenadaGuamGuatemalaGuineaGuinea-BissauGuyanaHaitiHeavily indebted poor countries (HIPC)High incomeHondurasHong Kong SAR, ChinaHungaryIBRD onlyIcelandIDA & IBRD totalIDA blendIDA onlyIDA totalIndiaIndonesiaIran, Islamic Rep.IraqIrelandIsraelItalyJamaicaJapanJordanKazakhstanKenyaKiribatiKorea, Dem. People’s Rep.Korea, Rep.KosovoKuwaitKyrgyz RepublicLao PDRLate-demographic dividendLatin America & Caribbean Latin America & Caribbean (excluding high income)Latin America & the Caribbean (IDA & IBRD countries)LatviaLeast developed countries: UN classificationLebanonLiberiaLibyaLithuaniaLow & middle incomeLow incomeLower middle incomeLuxembourgMacao SAR, ChinaMacedonia, FYRMadagascarMalawiMalaysiaMaldivesMaliMaltaMauritaniaMauritiusMexicoMiddle East & North AfricaMiddle East & North Africa (excluding high income)Middle East & North Africa (IDA & IBRD countries)Middle incomeMoldovaMongoliaMontenegroMoroccoMozambiqueMyanmarNauruNepalNetherlandsNew CaledoniaNew ZealandNicaraguaNigerNigeriaNorth AmericaNorwayOECD membersOmanOther small statesPacific island small statesPakistanPanamaPapua New GuineaParaguayPeruPhilippinesPolandPortugalPost-demographic dividendPre-demographic dividendQatarRomaniaRussian FederationRwandaSamoaSao Tome and PrincipeSaudi ArabiaSenegalSerbiaSeychellesSierra LeoneSingaporeSlovak RepublicSloveniaSmall statesSolomon IslandsSomaliaSouth AfricaSouth AsiaSouth Asia (IDA & IBRD)SpainSri LankaSt. Kitts and NevisSt. LuciaSt. Vincent and the GrenadinesSub-Saharan Africa Sub-Saharan Africa (excluding high income)Sub-Saharan Africa (IDA & IBRD countries)SudanSurinameSwedenSwitzerlandSyrian Arab RepublicTajikistanTanzaniaThailandTogoTongaTrinidad and TobagoTunisiaTurkeyTurkmenistanTuvaluUgandaUkraineUnited Arab EmiratesUnited KingdomUnited StatesUpper middle incomeUruguayUzbekistanVanuatuVenezuela, RBVietnamWorldYemen, Rep.ZambiaZimbabwe La ligne de temps
Cette échelle de temps montre un graphique de 1964 année à 2015 année Macao SAR, China. Les données jusqu'à 1963 année ne sont pas présentés. Quantité d'observations actuelles selon dates: 51.
Source (désignation):
Les indicateurs du développement mondiale
Source (organisation):
World Bank staff estimates based data from International Monetary Fund's Direction of Trade database.
Catégories:
Private Sector, Trade
Dernière mise à jour
23 avr. 2017
Les indicateurs de changement de valeurs selon les années
Minimum:
41.7 mln.
1 janv. 1964
Maximum:
11.262 mds
1 janv. 2015
Pour la date d''observation
Valeur
Changement absolu
Le changement par rapport à la valeur précédente
1 janv. 1964
41.7 mln.
+41.7 mln.
0.0%
1 janv. 1965
47.9 mln.
+6.2 mln.
14.87%
1 janv. 1966
46.8 mln.
-1.1 mln.
-2.3%
1 janv. 1967
50.9 mln.
+4.1 mln.
8.76%
1 janv. 1968
42.5 mln.
-8.4 mln.
-16.5%
1 janv. 1970
59.484 mln.
+16.984 mln.
39.96%
1 janv. 1971
64.989 mln.
+5.505 mln.
9.25%
1 janv. 1972
73.925 mln.
+8.936 mln.
13.75%
1 janv. 1973
103.295 mln.
+29.37 mln.
39.73%
1 janv. 1974
149.418 mln.
+46.123 mln.
44.65%
1 janv. 1975
126.382 mln.
-23.036 mln.
-15.42%
1 janv. 1976
153.212 mln.
+26.83 mln.
21.23%
1 janv. 1977
160.024 mln.
+6.812 mln.
4.45%
1 janv. 1978
198.446 mln.
+38.422 mln.
24.01%
1 janv. 1979
248.959 mln.
+50.513 mln.
25.45%
1 janv. 1980
350.833 mln.
+101.874 mln.
40.92%
1 janv. 1981
543.87 mln.
+193.037 mln.
55.02%
1 janv. 1982
716.095 mln.
+172.225 mln.
31.67%
1 janv. 1983
713.288 mln.
-2.807 mln.
-0.39%
1 janv. 1984
724.136 mln.
+10.848 mln.
1.52%
1 janv. 1985
593.436 mln.
-130.7 mln.
-18.05%
1 janv. 1986
775.683 mln.
+182.247 mln.
30.71%
1 janv. 1987
876.411 mln.
+100.728 mln.
12.99%
1 janv. 1988
1.112 mds
+235.171 mln.
26.83%
1 janv. 1989
1.283 mds
+170.938 mln.
15.38%
1 janv. 1990
1.47 mds
+187.776 mln.
14.64%
1 janv. 1991
1.532 mds
+61.402 mln.
4.18%
1 janv. 1992
1.851 mds
+318.807 mln.
20.81%
1 janv. 1993
1.951 mds
+100.802 mln.
5.45%
1 janv. 1994
1.985 mds
+33.628 mln.
1.72%
1 janv. 1995
2.097 mds
+112.519 mln.
5.67%
1 janv. 1996
2.049 mds
-48.491 mln.
-2.31%
1 janv. 1997
1.977 mds
-71.649 mln.
-3.5%
1 janv. 1998
2.171 mds
+193.477 mln.
9.78%
1 janv. 1999
1.937 mds
-233.604 mln.
-10.76%
1 janv. 2000
2.024 mds
+87.246 mln.
4.5%
1 janv. 2001
2.255 mds
+230.739 mln.
11.4%
1 janv. 2002
2.387 mds
+131.521 mln.
5.83%
1 janv. 2003
2.53 mds
+142.994 mln.
5.99%
1 janv. 2004
2.747 mds
+216.992 mln.
8.58%
1 janv. 2005
3.478 mds
+731.248 mln.
26.62%
1 janv. 2006
3.913 mds
+435.533 mln.
12.52%
1 janv. 2007
4.559 mds
+645.3 mln.
16.49%
1 janv. 2008
5.366 mds
+806.799 mln.
17.7%
1 janv. 2009
5.365 mds
-90.278 milles
0.0%
1 janv. 2010
4.622 mds
-743.596 mln.
-13.86%
1 janv. 2011
5.554 mds
+932.063 mln.
20.17%
1 janv. 2012
7.818 mds
+2.264 mds
40.76%
1 janv. 2013
9.03 mds
+1.212 mds
15.51%
1 janv. 2014
10.141 mds
+1.111 mds
12.3%
1 janv. 2015
11.262 mds
+1.122 mds
11.06%
Classement des pays selon les statistiques actuelles par années


Commentaires: