29
/fr/
fr
AIzaSyAYiBZKx7MnpbEhh9jyipgxe19OcubqV5w
April 1, 2024
216719
Pakistan
PAK
true
2
1
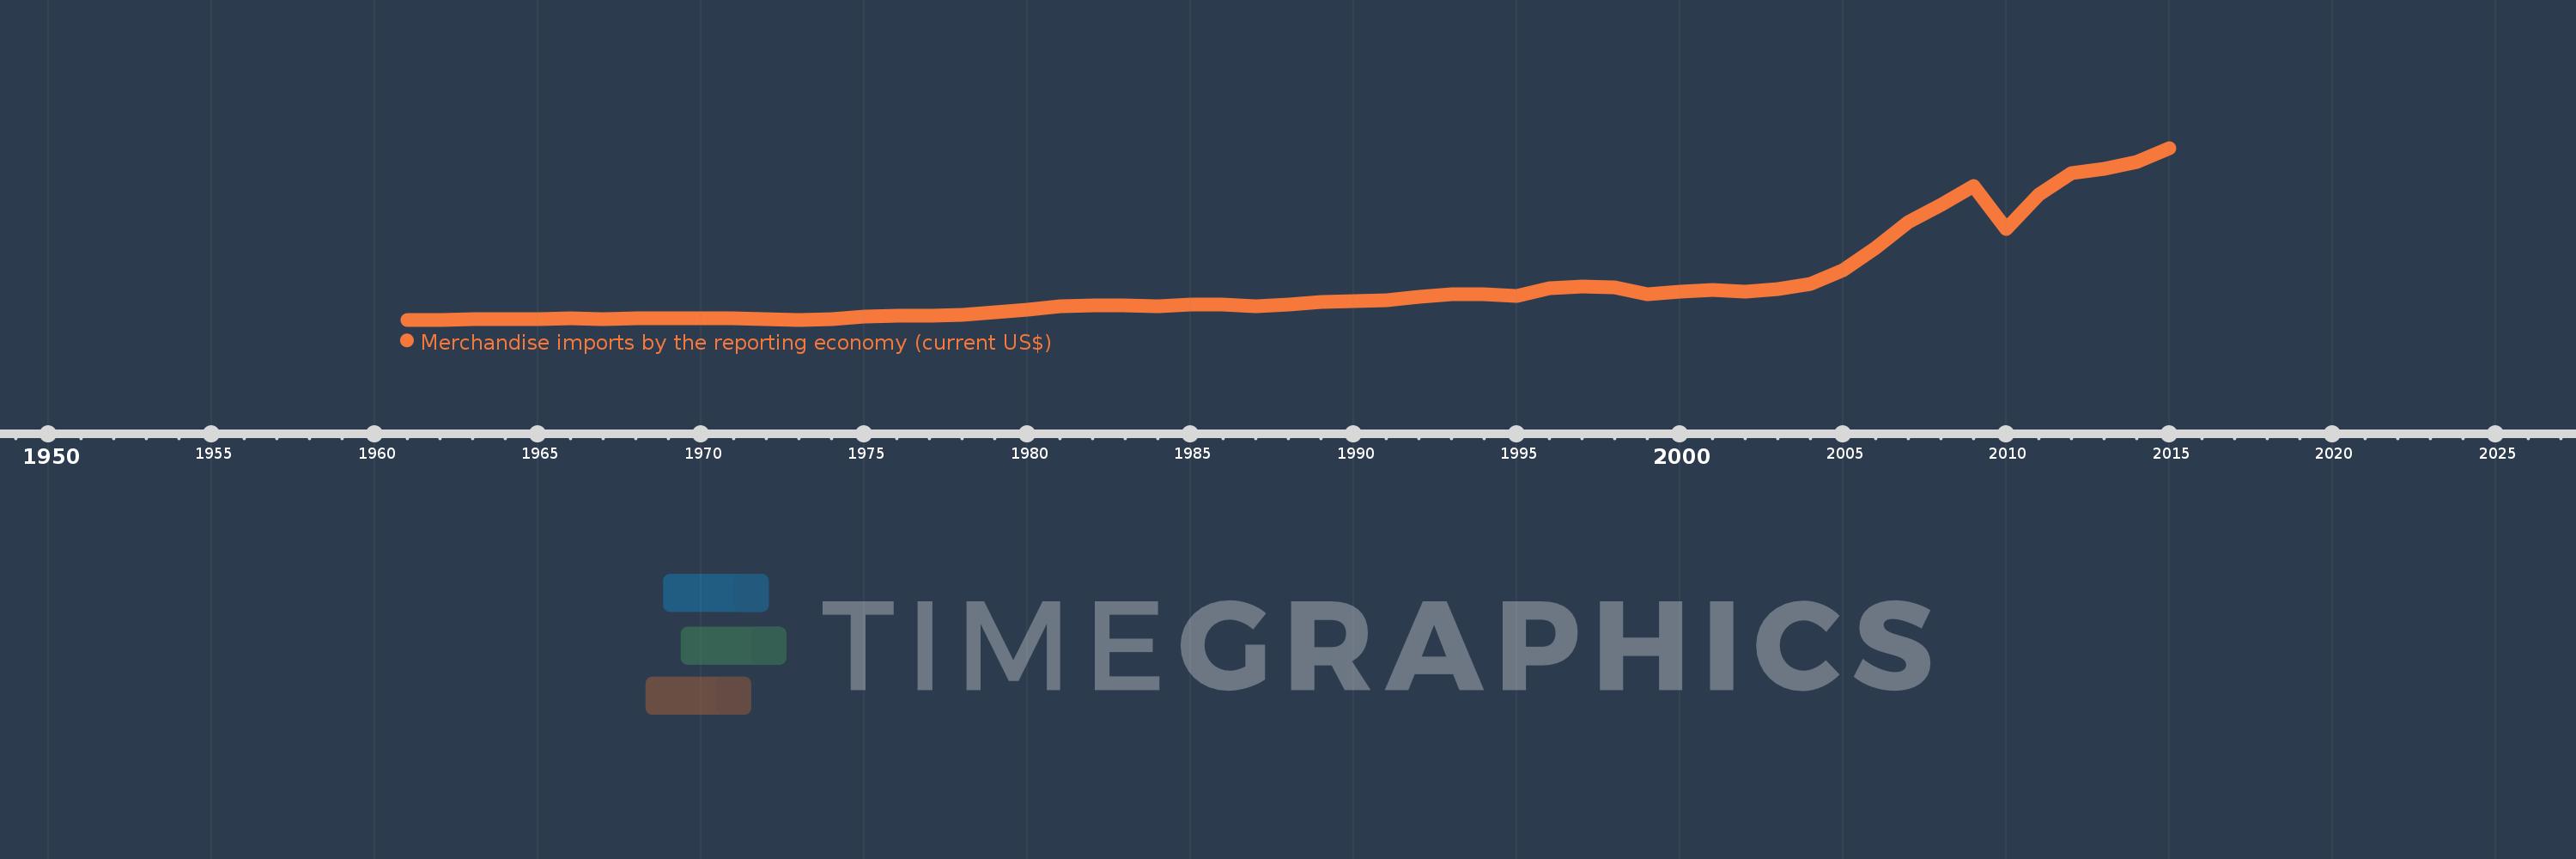
Merchandise imports by the reporting economy (current US$)
2015,2014,2013,2012,2011,2010,2009,2008,2007,2006,2005,2004,2003,2002,2001,2000,1999,1998,1997,1996,1995,1994,1993,1992,1991,1990,1989,1988,1987,1986,1985,1984,1983,1982,1981,1980,1979,1978,1977,1976,1975,1974,1973,1972,1971,1970,1969,1968,1967,1966,1965,1964,1963,1962,1961
Cette statistique dans les autres pays:
AfghanistanAlbaniaAlgeriaAmerican SamoaAngolaAntigua and BarbudaArab WorldArgentinaArmeniaArubaAustraliaAustriaAzerbaijanBahamas, TheBahrainBangladeshBarbadosBelarusBelgiumBelizeBeninBermudaBoliviaBosnia and HerzegovinaBrazilBrunei DarussalamBulgariaBurkina FasoBurundiCabo VerdeCambodiaCameroonCanadaCaribbean small statesCentral African RepublicCentral Europe and the BalticsChadChileChinaColombiaComorosCongo, Dem. Rep.Congo, Rep.Costa RicaCote d'IvoireCroatiaCubaCyprusCzech RepublicDenmarkDjiboutiDominicaDominican RepublicEarly-demographic dividendEast Asia & PacificEast Asia & Pacific (excluding high income)East Asia & Pacific (IDA & IBRD countries)EcuadorEgypt, Arab Rep.El SalvadorEquatorial GuineaEstoniaEthiopiaEuro areaEurope & Central AsiaEurope & Central Asia (excluding high income)Europe & Central Asia (IDA & IBRD countries)European UnionFaroe IslandsFijiFinlandFragile and conflict affected situationsFranceFrench PolynesiaGabonGambia, TheGeorgiaGermanyGhanaGibraltarGreeceGreenlandGrenadaGuamGuatemalaGuineaGuinea-BissauGuyanaHaitiHeavily indebted poor countries (HIPC)High incomeHondurasHong Kong SAR, ChinaHungaryIBRD onlyIcelandIDA & IBRD totalIDA blendIDA onlyIDA totalIndiaIndonesiaIran, Islamic Rep.IraqIrelandIsraelItalyJamaicaJapanJordanKazakhstanKenyaKiribatiKorea, Dem. People’s Rep.Korea, Rep.KosovoKuwaitKyrgyz RepublicLao PDRLate-demographic dividendLatin America & Caribbean Latin America & Caribbean (excluding high income)Latin America & the Caribbean (IDA & IBRD countries)LatviaLeast developed countries: UN classificationLebanonLiberiaLibyaLithuaniaLow & middle incomeLow incomeLower middle incomeLuxembourgMacao SAR, ChinaMacedonia, FYRMadagascarMalawiMalaysiaMaldivesMaliMaltaMauritaniaMauritiusMexicoMiddle East & North AfricaMiddle East & North Africa (excluding high income)Middle East & North Africa (IDA & IBRD countries)Middle incomeMoldovaMongoliaMontenegroMoroccoMozambiqueMyanmarNauruNepalNetherlandsNew CaledoniaNew ZealandNicaraguaNigerNigeriaNorth AmericaNorwayOECD membersOmanOther small statesPacific island small statesPakistanPanamaPapua New GuineaParaguayPeruPhilippinesPolandPortugalPost-demographic dividendPre-demographic dividendQatarRomaniaRussian FederationRwandaSamoaSao Tome and PrincipeSaudi ArabiaSenegalSerbiaSeychellesSierra LeoneSingaporeSlovak RepublicSloveniaSmall statesSolomon IslandsSomaliaSouth AfricaSouth AsiaSouth Asia (IDA & IBRD)SpainSri LankaSt. Kitts and NevisSt. LuciaSt. Vincent and the GrenadinesSub-Saharan Africa Sub-Saharan Africa (excluding high income)Sub-Saharan Africa (IDA & IBRD countries)SudanSurinameSwedenSwitzerlandSyrian Arab RepublicTajikistanTanzaniaThailandTogoTongaTrinidad and TobagoTunisiaTurkeyTurkmenistanTuvaluUgandaUkraineUnited Arab EmiratesUnited KingdomUnited StatesUpper middle incomeUruguayUzbekistanVanuatuVenezuela, RBVietnamWorldYemen, Rep.ZambiaZimbabwe La ligne de temps
Cette échelle de temps montre un graphique de 1961 année à 2015 année Pakistan. Les données jusqu'à 1960 année ne sont pas présentés. Quantité d'observations actuelles selon dates: 55.
Source (désignation):
Les indicateurs du développement mondiale
Source (organisation):
World Bank staff estimates based data from International Monetary Fund's Direction of Trade database.
Catégories:
Private Sector, Trade
Dernière mise à jour
23 avr. 2017
Les indicateurs de changement de valeurs selon les années
Minimum:
633.8 mln.
1 janv. 1962
Maximum:
59.54 mds
1 janv. 2015
Pour la date d''observation
Valeur
Changement absolu
Le changement par rapport à la valeur précédente
1 janv. 1961
643.7 mln.
+643.7 mln.
0.0%
1 janv. 1962
633.8 mln.
-9.9 mln.
-1.54%
1 janv. 1963
728.1 mln.
+94.3 mln.
14.88%
1 janv. 1964
880.4 mln.
+152.3 mln.
20.92%
1 janv. 1965
983.8 mln.
+103.4 mln.
11.74%
1 janv. 1966
1.035 mds
+51.2 mln.
5.2%
1 janv. 1967
899.2 mln.
-135.8 mln.
-13.12%
1 janv. 1968
1.098 mds
+198.8 mln.
22.11%
1 janv. 1969
1.048 mds
-49.5 mln.
-4.51%
1 janv. 1970
1.007 mds
-41.23 mln.
-3.93%
1 janv. 1971
1.102 mds
+94.67 mln.
9.4%
1 janv. 1972
915.96 mln.
-185.98 mln.
-16.88%
1 janv. 1973
666.43 mln.
-249.53 mln.
-27.24%
1 janv. 1974
973.61 mln.
+307.18 mln.
46.09%
1 janv. 1975
1.74 mds
+766.3 mln.
78.71%
1 janv. 1976
2.129 mds
+389.38 mln.
22.38%
1 janv. 1977
2.133 mds
+3.36 mln.
0.16%
1 janv. 1978
2.452 mds
+319.23 mln.
14.97%
1 janv. 1979
3.285 mds
+833.39 mln.
33.99%
1 janv. 1980
4.061 mds
+775.46 mln.
23.6%
1 janv. 1981
5.35 mds
+1.289 mds
31.74%
1 janv. 1982
5.632 mds
+282.06 mln.
5.27%
1 janv. 1983
5.45 mds
-181.62 mln.
-3.23%
1 janv. 1984
5.326 mds
-123.92 mln.
-2.27%
1 janv. 1985
5.854 mds
+527.74 mln.
9.91%
1 janv. 1986
5.889 mds
+34.73 mln.
0.59%
1 janv. 1987
5.367 mds
-521.29 mln.
-8.85%
1 janv. 1988
5.819 mds
+451.5 mln.
8.41%
1 janv. 1989
6.588 mds
+769.7 mln.
13.23%
1 janv. 1990
7.107 mds
+518.603 mln.
7.87%
1 janv. 1991
7.383 mds
+275.97 mln.
3.88%
1 janv. 1992
8.431 mds
+1.048 mds
14.2%
1 janv. 1993
9.375 mds
+943.556 mln.
11.19%
1 janv. 1994
9.492 mds
+117.384 mln.
1.25%
1 janv. 1995
8.885 mds
-607.911 mln.
-6.4%
1 janv. 1996
11.461 mds
+2.576 mds
28.99%
1 janv. 1997
12.15 mds
+689.332 mln.
6.01%
1 janv. 1998
11.612 mds
-537.993 mln.
-4.43%
1 janv. 1999
9.308 mds
-2.304 mds
-19.84%
1 janv. 2000
10.298 mds
+989.49 mln.
10.63%
1 janv. 2001
10.722 mds
+424.291 mln.
4.12%
1 janv. 2002
10.166 mds
-556.425 mln.
-5.19%
1 janv. 2003
11.238 mds
+1.073 mds
10.55%
1 janv. 2004
13.049 mds
+1.81 mds
16.11%
1 janv. 2005
17.757 mds
+4.709 mds
36.09%
1 janv. 2006
25.411 mds
+7.653 mds
43.1%
1 janv. 2007
34.196 mds
+8.785 mds
34.57%
1 janv. 2008
39.901 mds
+5.705 mds
16.68%
1 janv. 2009
46.427 mds
+6.526 mds
16.35%
1 janv. 2010
31.648 mds
-14.779 mds
-31.83%
1 janv. 2011
43.595 mds
+11.948 mds
37.75%
1 janv. 2012
51.036 mds
+7.44 mds
17.07%
1 janv. 2013
52.263 mds
+1.228 mds
2.41%
1 janv. 2014
54.639 mds
+2.376 mds
4.55%
1 janv. 2015
59.54 mds
+4.9 mds
8.97%
Classement des pays selon les statistiques actuelles par années


Commentaires: