29
/fr/
fr
AIzaSyAYiBZKx7MnpbEhh9jyipgxe19OcubqV5w
April 1, 2024
179123
Liberia
LBR
true
2
1
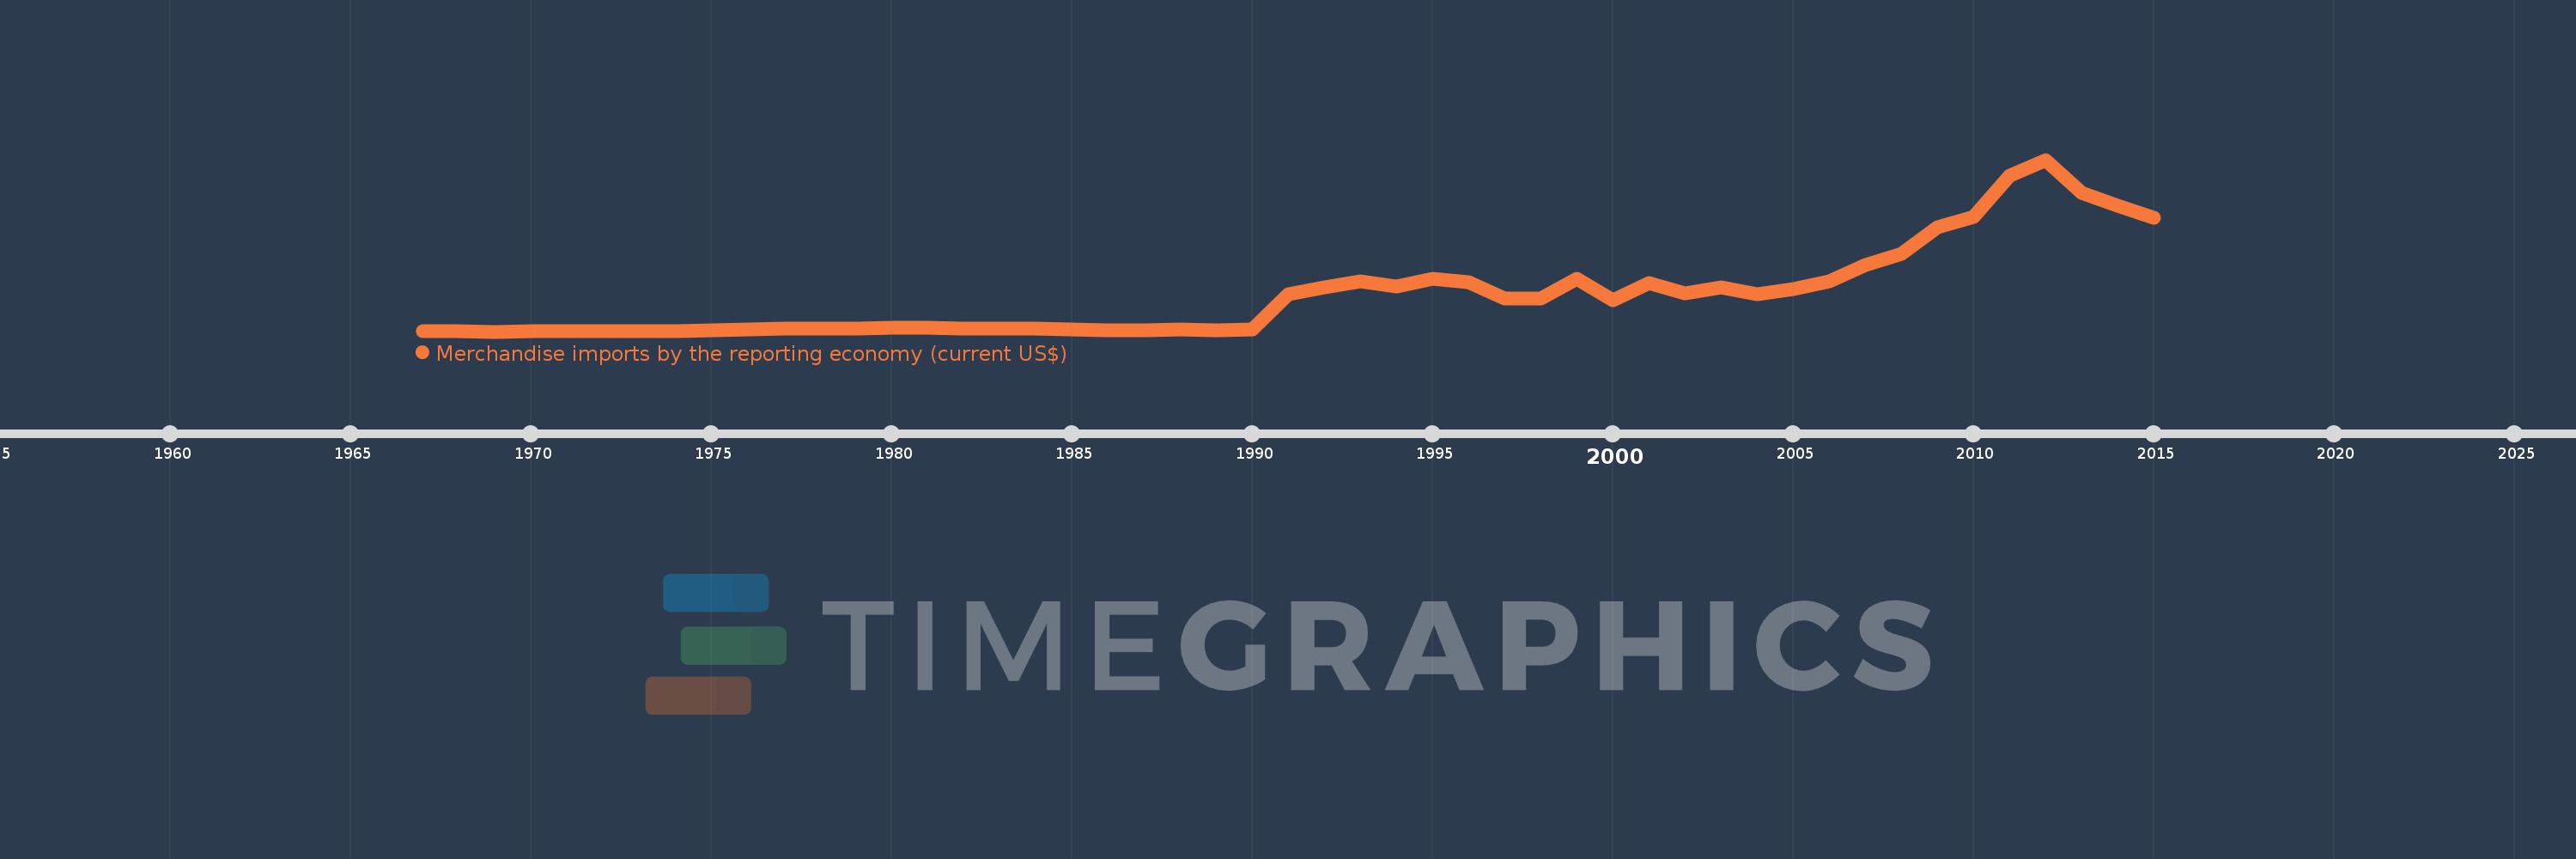
Merchandise imports by the reporting economy (current US$)
2015,2014,2013,2012,2011,2010,2009,2008,2007,2006,2005,2004,2003,2002,2001,2000,1999,1998,1997,1996,1995,1994,1993,1992,1991,1990,1989,1988,1987,1986,1985,1984,1983,1982,1981,1980,1979,1978,1977,1976,1975,1974,1973,1972,1971,1970,1969,1968,1967
Cette statistique dans les autres pays:
AfghanistanAlbaniaAlgeriaAmerican SamoaAngolaAntigua and BarbudaArab WorldArgentinaArmeniaArubaAustraliaAustriaAzerbaijanBahamas, TheBahrainBangladeshBarbadosBelarusBelgiumBelizeBeninBermudaBoliviaBosnia and HerzegovinaBrazilBrunei DarussalamBulgariaBurkina FasoBurundiCabo VerdeCambodiaCameroonCanadaCaribbean small statesCentral African RepublicCentral Europe and the BalticsChadChileChinaColombiaComorosCongo, Dem. Rep.Congo, Rep.Costa RicaCote d'IvoireCroatiaCubaCyprusCzech RepublicDenmarkDjiboutiDominicaDominican RepublicEarly-demographic dividendEast Asia & PacificEast Asia & Pacific (excluding high income)East Asia & Pacific (IDA & IBRD countries)EcuadorEgypt, Arab Rep.El SalvadorEquatorial GuineaEstoniaEthiopiaEuro areaEurope & Central AsiaEurope & Central Asia (excluding high income)Europe & Central Asia (IDA & IBRD countries)European UnionFaroe IslandsFijiFinlandFragile and conflict affected situationsFranceFrench PolynesiaGabonGambia, TheGeorgiaGermanyGhanaGibraltarGreeceGreenlandGrenadaGuamGuatemalaGuineaGuinea-BissauGuyanaHaitiHeavily indebted poor countries (HIPC)High incomeHondurasHong Kong SAR, ChinaHungaryIBRD onlyIcelandIDA & IBRD totalIDA blendIDA onlyIDA totalIndiaIndonesiaIran, Islamic Rep.IraqIrelandIsraelItalyJamaicaJapanJordanKazakhstanKenyaKiribatiKorea, Dem. People’s Rep.Korea, Rep.KosovoKuwaitKyrgyz RepublicLao PDRLate-demographic dividendLatin America & Caribbean Latin America & Caribbean (excluding high income)Latin America & the Caribbean (IDA & IBRD countries)LatviaLeast developed countries: UN classificationLebanonLiberiaLibyaLithuaniaLow & middle incomeLow incomeLower middle incomeLuxembourgMacao SAR, ChinaMacedonia, FYRMadagascarMalawiMalaysiaMaldivesMaliMaltaMauritaniaMauritiusMexicoMiddle East & North AfricaMiddle East & North Africa (excluding high income)Middle East & North Africa (IDA & IBRD countries)Middle incomeMoldovaMongoliaMontenegroMoroccoMozambiqueMyanmarNauruNepalNetherlandsNew CaledoniaNew ZealandNicaraguaNigerNigeriaNorth AmericaNorwayOECD membersOmanOther small statesPacific island small statesPakistanPanamaPapua New GuineaParaguayPeruPhilippinesPolandPortugalPost-demographic dividendPre-demographic dividendQatarRomaniaRussian FederationRwandaSamoaSao Tome and PrincipeSaudi ArabiaSenegalSerbiaSeychellesSierra LeoneSingaporeSlovak RepublicSloveniaSmall statesSolomon IslandsSomaliaSouth AfricaSouth AsiaSouth Asia (IDA & IBRD)SpainSri LankaSt. Kitts and NevisSt. LuciaSt. Vincent and the GrenadinesSub-Saharan Africa Sub-Saharan Africa (excluding high income)Sub-Saharan Africa (IDA & IBRD countries)SudanSurinameSwedenSwitzerlandSyrian Arab RepublicTajikistanTanzaniaThailandTogoTongaTrinidad and TobagoTunisiaTurkeyTurkmenistanTuvaluUgandaUkraineUnited Arab EmiratesUnited KingdomUnited StatesUpper middle incomeUruguayUzbekistanVanuatuVenezuela, RBVietnamWorldYemen, Rep.ZambiaZimbabwe La ligne de temps
Cette échelle de temps montre un graphique de 1967 année à 2015 année Liberia. Les données jusqu'à 1966 année ne sont pas présentés. Quantité d'observations actuelles selon dates: 49.
Source (désignation):
Les indicateurs du développement mondiale
Source (organisation):
World Bank staff estimates based data from International Monetary Fund's Direction of Trade database.
Catégories:
Private Sector, Trade
Dernière mise à jour
23 avr. 2017
Les indicateurs de changement de valeurs selon les années
Minimum:
108.565 mln.
1 janv. 1969
Maximum:
19.343 mds
1 janv. 2012
Pour la date d''observation
Valeur
Changement absolu
Le changement par rapport à la valeur précédente
1 janv. 1967
112.5 mln.
+112.5 mln.
0.0%
1 janv. 1968
144.762 mln.
+32.262 mln.
28.68%
1 janv. 1969
108.565 mln.
-36.197 mln.
-25.0%
1 janv. 1970
114.655 mln.
+6.09 mln.
5.61%
1 janv. 1971
149.699 mln.
+35.044 mln.
30.56%
1 janv. 1972
162.424 mln.
+12.725 mln.
8.5%
1 janv. 1973
178.681 mln.
+16.257 mln.
10.01%
1 janv. 1974
193.465 mln.
+14.784 mln.
8.27%
1 janv. 1975
288.421 mln.
+94.956 mln.
49.08%
1 janv. 1976
331.209 mln.
+42.788 mln.
14.84%
1 janv. 1977
399.219 mln.
+68.01 mln.
20.53%
1 janv. 1978
461.282 mln.
+62.063 mln.
15.55%
1 janv. 1979
478.456 mln.
+17.174 mln.
3.72%
1 janv. 1980
507.149 mln.
+28.693 mln.
6.0%
1 janv. 1981
534.891 mln.
+27.742 mln.
5.47%
1 janv. 1982
477.402 mln.
-57.489 mln.
-10.75%
1 janv. 1983
428.303 mln.
-49.099 mln.
-10.28%
1 janv. 1984
411.596 mln.
-16.707 mln.
-3.9%
1 janv. 1985
363.184 mln.
-48.412 mln.
-11.76%
1 janv. 1986
284.4 mln.
-78.784 mln.
-21.69%
1 janv. 1987
258.725 mln.
-25.675 mln.
-9.03%
1 janv. 1988
307.74 mln.
+49.015 mln.
18.94%
1 janv. 1989
290.717 mln.
-17.023 mln.
-5.53%
1 janv. 1990
322.988 mln.
+32.271 mln.
11.1%
1 janv. 1991
4.259 mds
+3.936 mds
1.22 milles%
1 janv. 1992
5.036 mds
+777.767 mln.
18.26%
1 janv. 1993
5.767 mds
+730.694 mln.
14.51%
1 janv. 1994
5.171 mds
-596.563 mln.
-10.34%
1 janv. 1995
6.056 mds
+885.642 mln.
17.13%
1 janv. 1996
5.683 mds
-373.219 mln.
-6.16%
1 janv. 1997
3.82 mds
-1.863 mds
-32.78%
1 janv. 1998
3.783 mds
-36.818 mln.
-0.96%
1 janv. 1999
5.98 mds
+2.197 mds
58.08%
1 janv. 2000
3.597 mds
-2.384 mds
-39.86%
1 janv. 2001
5.537 mds
+1.94 mds
53.94%
1 janv. 2002
4.413 mds
-1.124 mds
-20.29%
1 janv. 2003
5.03 mds
+617.025 mln.
13.98%
1 janv. 2004
4.274 mds
-756.395 mln.
-15.04%
1 janv. 2005
4.905 mds
+631.201 mln.
14.77%
1 janv. 2006
5.707 mds
+802.085 mln.
16.35%
1 janv. 2007
7.56 mds
+1.853 mds
32.47%
1 janv. 2008
8.836 mds
+1.276 mds
16.88%
1 janv. 2009
11.774 mds
+2.938 mds
33.25%
1 janv. 2010
12.941 mds
+1.166 mds
9.91%
1 janv. 2011
17.585 mds
+4.644 mds
35.88%
1 janv. 2012
19.343 mds
+1.758 mds
10.0%
1 janv. 2013
15.679 mds
-3.663 mds
-18.94%
1 janv. 2014
14.244 mds
-1.435 mds
-9.15%
1 janv. 2015
12.813 mds
-1.431 mds
-10.04%
Classement des pays selon les statistiques actuelles par années


Commentaires: