29
/fr/
fr
AIzaSyAYiBZKx7MnpbEhh9jyipgxe19OcubqV5w
April 1, 2024
56011
Small states
SST
false
2
1
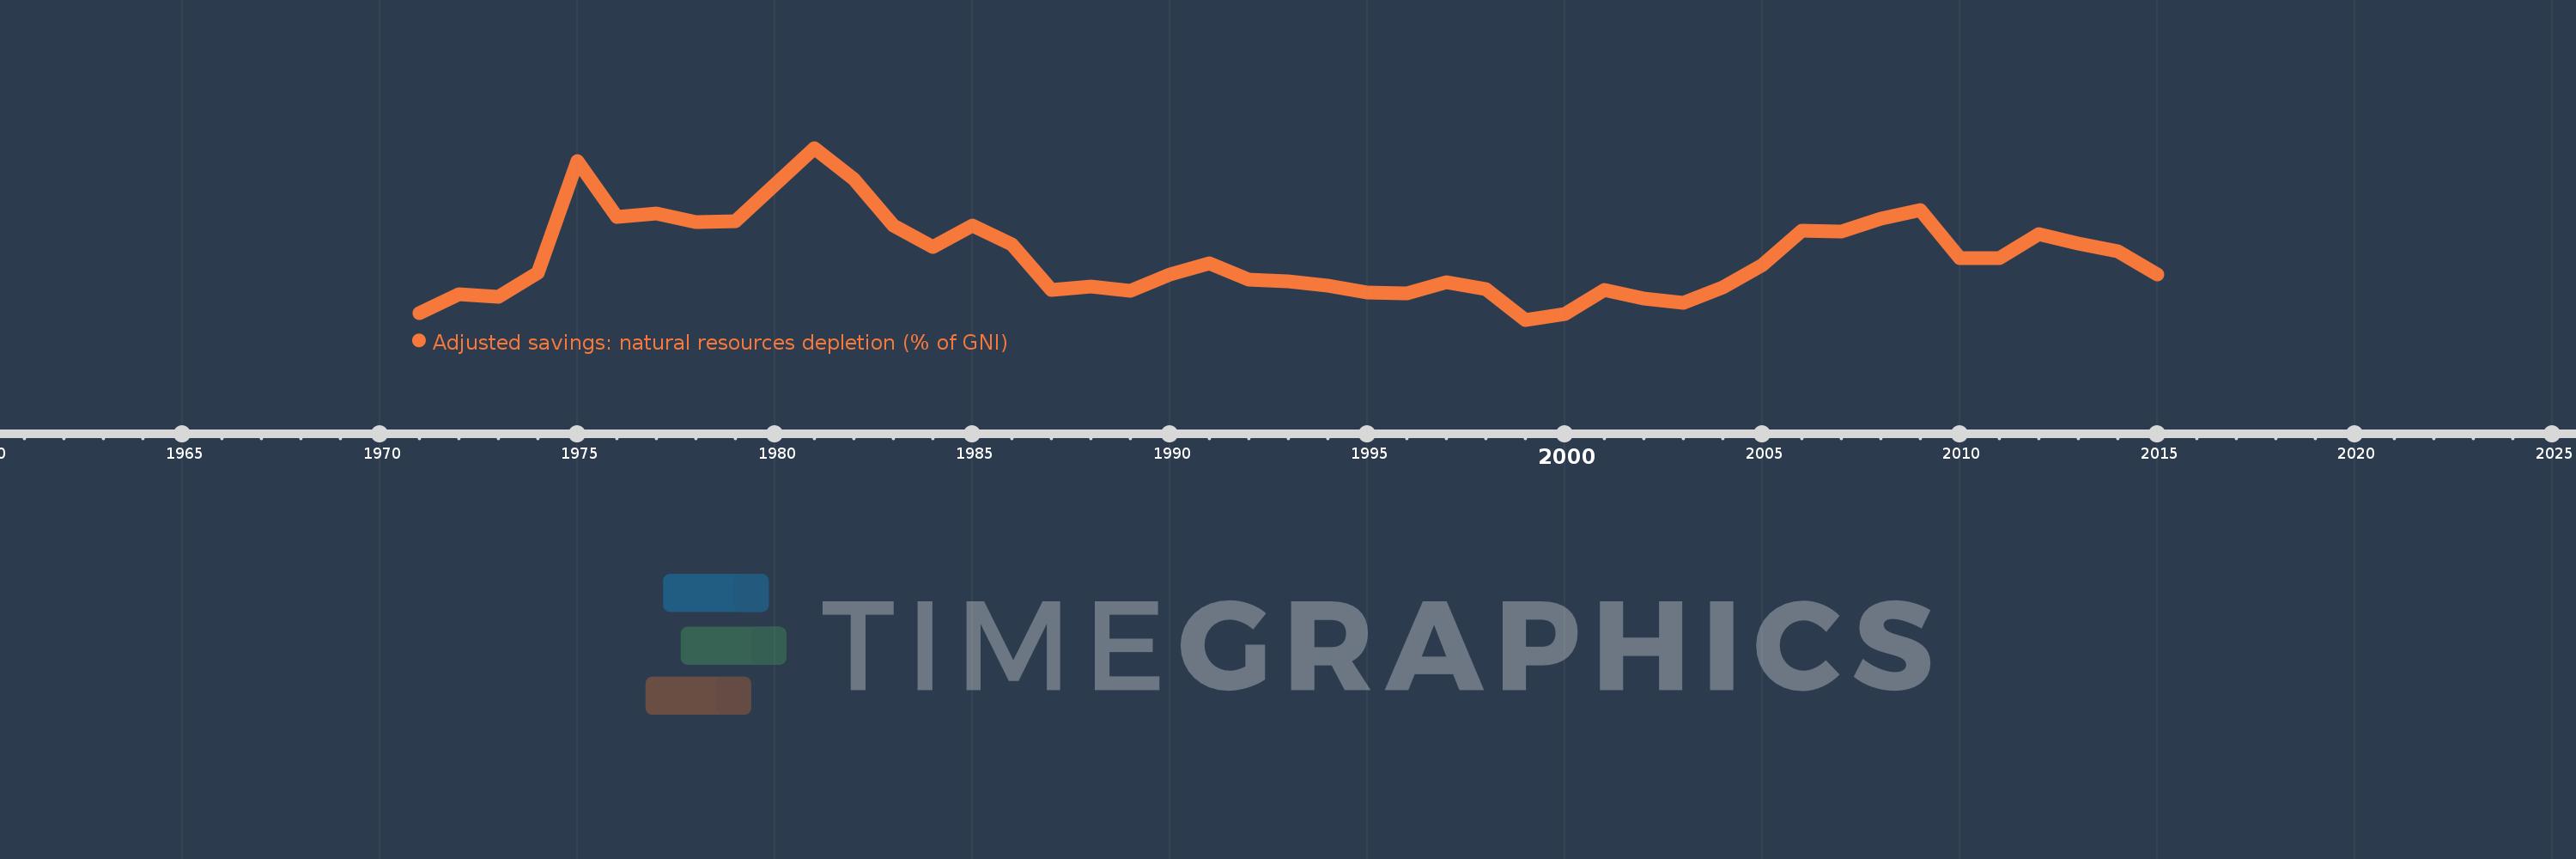
Adjusted savings: natural resources depletion (% of GNI)
2015,2014,2013,2012,2011,2010,2009,2008,2007,2006,2005,2004,2003,2002,2001,2000,1999,1998,1997,1996,1995,1994,1993,1992,1991,1990,1989,1988,1987,1986,1985,1984,1983,1982,1981,1979,1978,1977,1976,1975,1974,1973,1972,1971
Cette statistique dans les autres pays:
AfghanistanAlbaniaAlgeriaAngolaArab WorldArgentinaArmeniaAustraliaAustriaAzerbaijanBahamas, TheBahrainBangladeshBarbadosBelarusBelgiumBelizeBeninBhutanBoliviaBotswanaBrazilBrunei DarussalamBulgariaBurkina FasoBurundiCabo VerdeCambodiaCameroonCanadaCaribbean small statesCentral African RepublicCentral Europe and the BalticsChadChileChinaColombiaComorosCongo, Dem. Rep.Congo, Rep.Costa RicaCote d'IvoireCroatiaCubaCyprusCzech RepublicDenmarkDjiboutiDominicaDominican RepublicEarly-demographic dividendEast Asia & PacificEast Asia & Pacific (excluding high income)East Asia & Pacific (IDA & IBRD countries)EcuadorEgypt, Arab Rep.El SalvadorEquatorial GuineaEritreaEstoniaEthiopiaEuro areaEurope & Central AsiaEurope & Central Asia (excluding high income)Europe & Central Asia (IDA & IBRD countries)European UnionFijiFinlandFragile and conflict affected situationsFranceFrench PolynesiaGabonGambia, TheGeorgiaGermanyGhanaGreeceGuatemalaGuineaGuinea-BissauGuyanaHaitiHeavily indebted poor countries (HIPC)High incomeHondurasHong Kong SAR, ChinaHungaryIBRD onlyIcelandIDA & IBRD totalIDA blendIDA onlyIDA totalIndiaIndonesiaIran, Islamic Rep.IraqIrelandIsraelItalyJamaicaJapanJordanKazakhstanKenyaKiribatiKorea, Rep.KuwaitKyrgyz RepublicLao PDRLate-demographic dividendLatin America & Caribbean Latin America & Caribbean (excluding high income)Latin America & the Caribbean (IDA & IBRD countries)LatviaLeast developed countries: UN classificationLebanonLesothoLiberiaLibyaLithuaniaLow & middle incomeLow incomeLower middle incomeLuxembourgMacedonia, FYRMadagascarMalawiMalaysiaMaldivesMaliMauritaniaMauritiusMexicoMicronesia, Fed. Sts.Middle East & North AfricaMiddle East & North Africa (excluding high income)Middle East & North Africa (IDA & IBRD countries)Middle incomeMoldovaMongoliaMoroccoMozambiqueMyanmarNamibiaNepalNetherlandsNew CaledoniaNew ZealandNicaraguaNigerNigeriaNorth AmericaNorwayOECD membersOmanOther small statesPacific island small statesPakistanPanamaPapua New GuineaParaguayPeruPhilippinesPolandPortugalPost-demographic dividendPre-demographic dividendQatarRomaniaRussian FederationRwandaSamoaSao Tome and PrincipeSaudi ArabiaSenegalSeychellesSierra LeoneSingaporeSlovak RepublicSloveniaSmall statesSolomon IslandsSomaliaSouth AfricaSouth AsiaSouth Asia (IDA & IBRD)SpainSri LankaSt. LuciaSt. Vincent and the GrenadinesSub-Saharan Africa Sub-Saharan Africa (excluding high income)Sub-Saharan Africa (IDA & IBRD countries)SudanSurinameSwazilandSwedenSwitzerlandSyrian Arab RepublicTajikistanTanzaniaThailandTogoTongaTrinidad and TobagoTunisiaTurkeyTurkmenistanUgandaUkraineUnited Arab EmiratesUnited KingdomUnited StatesUpper middle incomeUruguayUzbekistanVanuatuVenezuela, RBVietnamWorldYemen, Rep.ZambiaZimbabwe La ligne de temps
Cette échelle de temps montre un graphique de 1971 année à 2015 année Small states. Les données jusqu'à 1970 année ne sont pas présentés. Quantité d'observations actuelles selon dates: 44.
Source (désignation):
Les indicateurs du développement mondiale
Source (organisation):
World Bank staff estimates based on sources and methods in World Bank's "The Changing Wealth of Nations: Measuring Sustainable Development in the New Millennium" (2011).
Catégories:
Economy & Growth, Energy & Mining
Dernière mise à jour
23 avr. 2017
Les indicateurs de changement de valeurs selon les années
Minimum:
4.807
1 janv. 1999
Maximum:
31.145
1 janv. 1981
Pour la date d''observation
Valeur
Changement absolu
Le changement par rapport à la valeur précédente
1 janv. 1971
5.864
+5.864
0.0%
1 janv. 1972
8.679
+2.816
48.02%
1 janv. 1973
8.285
-0.394
-4.54%
1 janv. 1974
12.005
+3.72
44.89%
1 janv. 1975
29.082
+17.077
142.24%
1 janv. 1976
20.601
-8.48
-29.16%
1 janv. 1977
21.047
+0.446
2.16%
1 janv. 1978
19.795
-1.253
-5.95%
1 janv. 1979
19.893
+0.099
0.5%
1 janv. 1981
31.145
+11.252
56.56%
1 janv. 1982
26.341
-4.804
-15.42%
1 janv. 1983
19.291
-7.05
-26.77%
1 janv. 1984
15.905
-3.386
-17.55%
1 janv. 1985
19.257
+3.351
21.07%
1 janv. 1986
16.403
-2.854
-14.82%
1 janv. 1987
9.344
-7.058
-43.03%
1 janv. 1988
9.881
+0.537
5.75%
1 janv. 1989
9.199
-0.682
-6.9%
1 janv. 1990
11.812
+2.613
28.4%
1 janv. 1991
13.418
+1.606
13.59%
1 janv. 1992
10.971
-2.447
-18.23%
1 janv. 1993
10.635
-0.336
-3.06%
1 janv. 1994
9.985
-0.65
-6.11%
1 janv. 1995
8.992
-0.993
-9.95%
1 janv. 1996
8.797
-0.194
-2.16%
1 janv. 1997
10.582
+1.785
20.28%
1 janv. 1998
9.573
-1.009
-9.54%
1 janv. 1999
4.807
-4.766
-49.78%
1 janv. 2000
5.712
+0.905
18.82%
1 janv. 2001
9.418
+3.707
64.89%
1 janv. 2002
8.077
-1.341
-14.24%
1 janv. 2003
7.434
-0.643
-7.96%
1 janv. 2004
9.77
+2.336
31.43%
1 janv. 2005
13.224
+3.454
35.35%
1 janv. 2006
18.423
+5.199
39.32%
1 janv. 2007
18.346
-0.077
-0.42%
1 janv. 2008
20.275
+1.929
10.51%
1 janv. 2009
21.578
+1.304
6.43%
1 janv. 2010
14.272
-7.306
-33.86%
1 janv. 2011
14.315
+0.043
0.3%
1 janv. 2012
17.936
+3.621
25.3%
1 janv. 2013
16.478
-1.458
-8.13%
1 janv. 2014
15.341
-1.138
-6.9%
1 janv. 2015
11.807
-3.533
-23.03%
Classement des pays selon les statistiques actuelles par années


Commentaires: