29
/fr/
fr
AIzaSyAYiBZKx7MnpbEhh9jyipgxe19OcubqV5w
April 1, 2024
160191
Israel
ISR
true
2
1
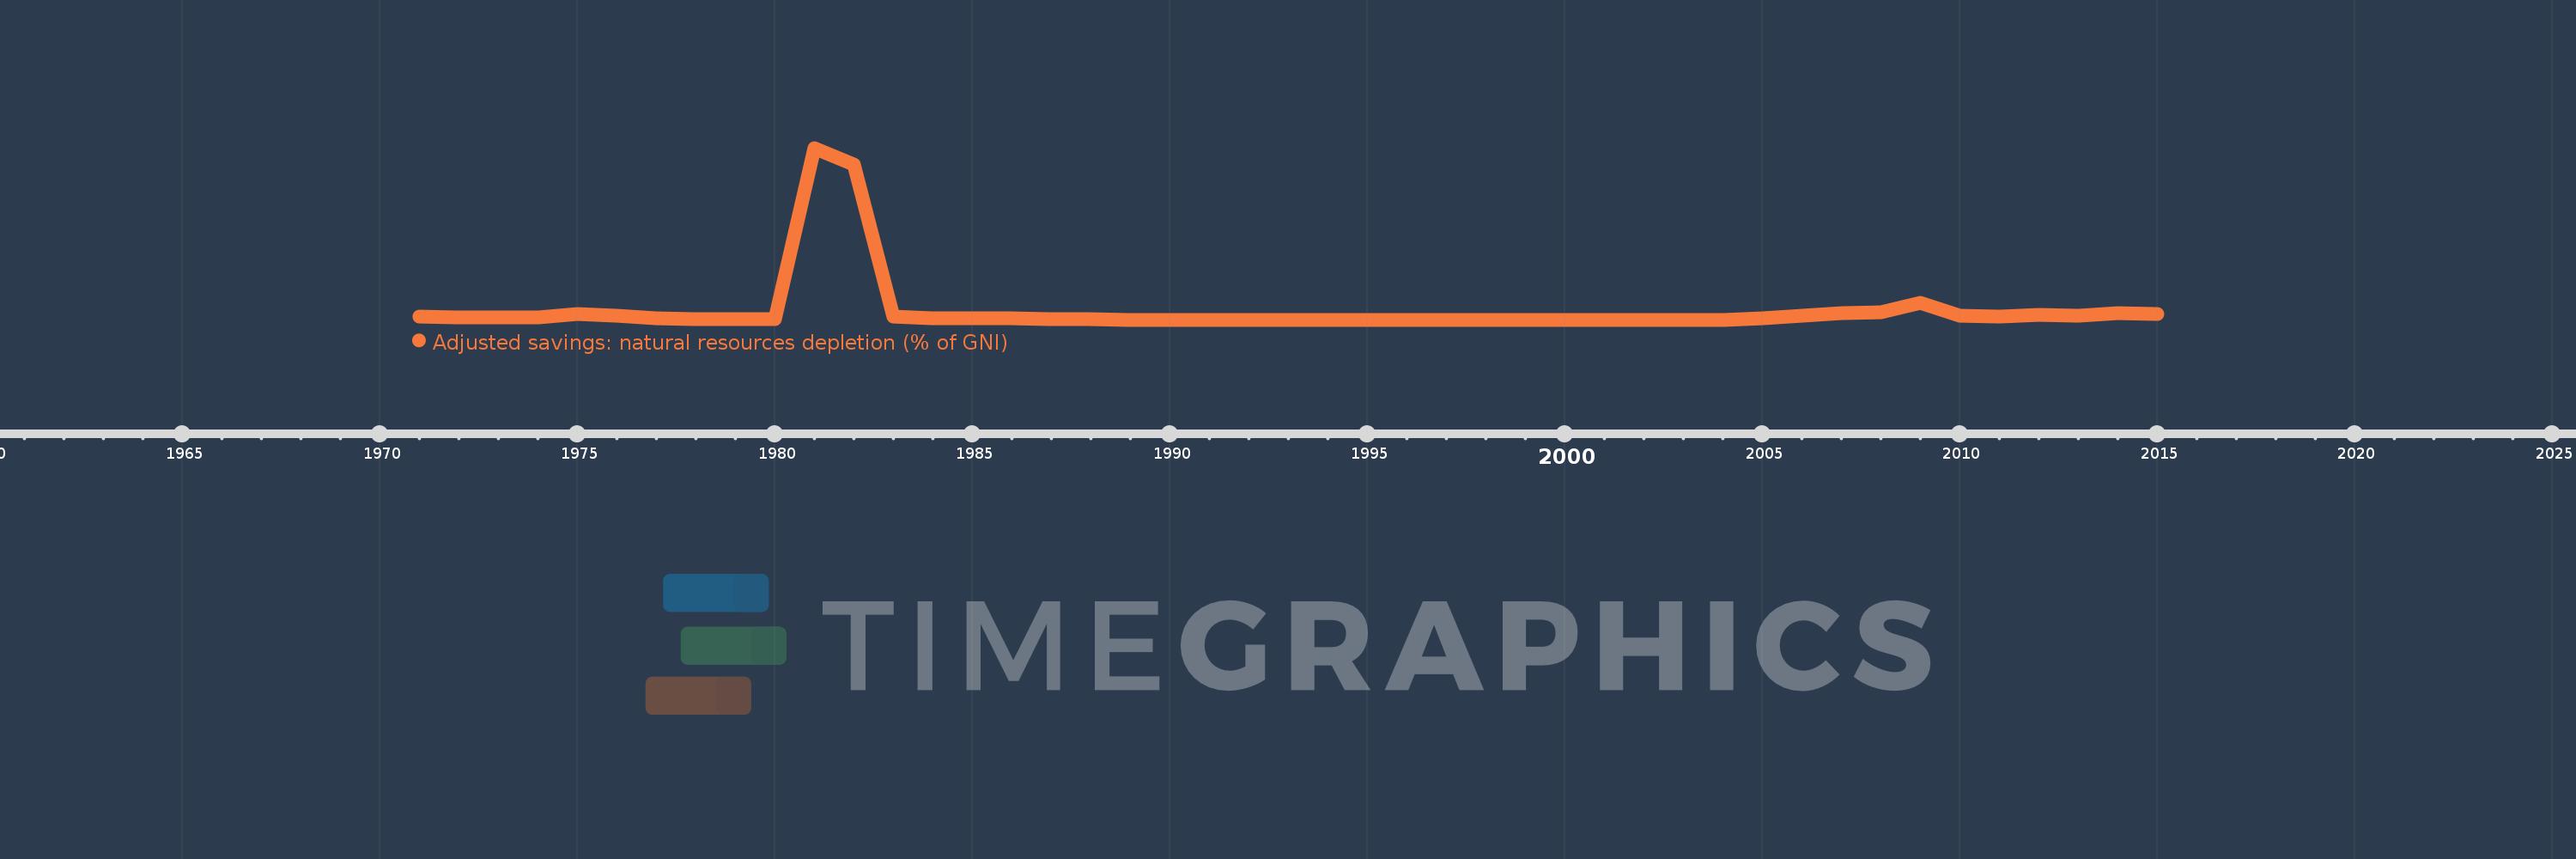
Adjusted savings: natural resources depletion (% of GNI)
2015,2014,2013,2012,2011,2010,2009,2008,2007,2006,2005,2004,2003,2002,2001,2000,1999,1998,1997,1996,1995,1994,1993,1992,1991,1990,1989,1988,1987,1986,1985,1984,1983,1982,1981,1980,1979,1978,1977,1976,1975,1974,1973,1972,1971
Cette statistique dans les autres pays:
AfghanistanAlbaniaAlgeriaAngolaArab WorldArgentinaArmeniaAustraliaAustriaAzerbaijanBahamas, TheBahrainBangladeshBarbadosBelarusBelgiumBelizeBeninBhutanBoliviaBotswanaBrazilBrunei DarussalamBulgariaBurkina FasoBurundiCabo VerdeCambodiaCameroonCanadaCaribbean small statesCentral African RepublicCentral Europe and the BalticsChadChileChinaColombiaComorosCongo, Dem. Rep.Congo, Rep.Costa RicaCote d'IvoireCroatiaCubaCyprusCzech RepublicDenmarkDjiboutiDominicaDominican RepublicEarly-demographic dividendEast Asia & PacificEast Asia & Pacific (excluding high income)East Asia & Pacific (IDA & IBRD countries)EcuadorEgypt, Arab Rep.El SalvadorEquatorial GuineaEritreaEstoniaEthiopiaEuro areaEurope & Central AsiaEurope & Central Asia (excluding high income)Europe & Central Asia (IDA & IBRD countries)European UnionFijiFinlandFragile and conflict affected situationsFranceFrench PolynesiaGabonGambia, TheGeorgiaGermanyGhanaGreeceGuatemalaGuineaGuinea-BissauGuyanaHaitiHeavily indebted poor countries (HIPC)High incomeHondurasHong Kong SAR, ChinaHungaryIBRD onlyIcelandIDA & IBRD totalIDA blendIDA onlyIDA totalIndiaIndonesiaIran, Islamic Rep.IraqIrelandIsraelItalyJamaicaJapanJordanKazakhstanKenyaKiribatiKorea, Rep.KuwaitKyrgyz RepublicLao PDRLate-demographic dividendLatin America & Caribbean Latin America & Caribbean (excluding high income)Latin America & the Caribbean (IDA & IBRD countries)LatviaLeast developed countries: UN classificationLebanonLesothoLiberiaLibyaLithuaniaLow & middle incomeLow incomeLower middle incomeLuxembourgMacedonia, FYRMadagascarMalawiMalaysiaMaldivesMaliMauritaniaMauritiusMexicoMicronesia, Fed. Sts.Middle East & North AfricaMiddle East & North Africa (excluding high income)Middle East & North Africa (IDA & IBRD countries)Middle incomeMoldovaMongoliaMoroccoMozambiqueMyanmarNamibiaNepalNetherlandsNew CaledoniaNew ZealandNicaraguaNigerNigeriaNorth AmericaNorwayOECD membersOmanOther small statesPacific island small statesPakistanPanamaPapua New GuineaParaguayPeruPhilippinesPolandPortugalPost-demographic dividendPre-demographic dividendQatarRomaniaRussian FederationRwandaSamoaSao Tome and PrincipeSaudi ArabiaSenegalSeychellesSierra LeoneSingaporeSlovak RepublicSloveniaSmall statesSolomon IslandsSomaliaSouth AfricaSouth AsiaSouth Asia (IDA & IBRD)SpainSri LankaSt. LuciaSt. Vincent and the GrenadinesSub-Saharan Africa Sub-Saharan Africa (excluding high income)Sub-Saharan Africa (IDA & IBRD countries)SudanSurinameSwazilandSwedenSwitzerlandSyrian Arab RepublicTajikistanTanzaniaThailandTogoTongaTrinidad and TobagoTunisiaTurkeyTurkmenistanUgandaUkraineUnited Arab EmiratesUnited KingdomUnited StatesUpper middle incomeUruguayUzbekistanVanuatuVenezuela, RBVietnamWorldYemen, Rep.ZambiaZimbabwe La ligne de temps
Cette échelle de temps montre un graphique de 1971 année à 2015 année Israel. Les données jusqu'à 1970 année ne sont pas présentés. Quantité d'observations actuelles selon dates: 45.
Source (désignation):
Les indicateurs du développement mondiale
Source (organisation):
World Bank staff estimates based on sources and methods in World Bank's "The Changing Wealth of Nations: Measuring Sustainable Development in the New Millennium" (2011).
Catégories:
Economy & Growth, Energy & Mining
Dernière mise à jour
23 avr. 2017
Les indicateurs de changement de valeurs selon les années
Minimum:
0.001
1 janv. 2003
Maximum:
6.435
1 janv. 1981
Pour la date d''observation
Valeur
Changement absolu
Le changement par rapport à la valeur précédente
1 janv. 1971
0.123
+0.123
0.0%
1 janv. 1972
0.101
-0.022
-18.1%
1 janv. 1973
0.081
-0.019
-19.32%
1 janv. 1974
0.092
+0.011
13.64%
1 janv. 1975
0.204
+0.112
121.34%
1 janv. 1976
0.148
-0.056
-27.25%
1 janv. 1977
0.057
-0.092
-61.82%
1 janv. 1978
0.03
-0.027
-47.33%
1 janv. 1979
0.014
-0.016
-53.9%
1 janv. 1980
0.02
+0.006
46.87%
1 janv. 1981
6.435
+6.415
31.74 milles%
1 janv. 1982
5.808
-0.627
-9.75%
1 janv. 1983
0.105
-5.702
-98.19%
1 janv. 1984
0.06
-0.046
-43.17%
1 janv. 1985
0.071
+0.011
18.77%
1 janv. 1986
0.048
-0.023
-32.53%
1 janv. 1987
0.02
-0.028
-58.12%
1 janv. 1988
0.009
-0.011
-56.44%
1 janv. 1989
0.006
-0.003
-28.84%
1 janv. 1990
0.006
-0.001
-11.47%
1 janv. 1991
0.007
+0.002
35.64%
1 janv. 1992
0.005
-0.003
-34.08%
1 janv. 1993
0.004
-0.001
-17.37%
1 janv. 1994
0.004
0.0
-7.29%
1 janv. 1995
0.003
-0.001
-30.33%
1 janv. 1996
0.002
0.0
-16.62%
1 janv. 1997
0.002
-0.001
-26.6%
1 janv. 1998
0.003
+0.001
56.1%
1 janv. 1999
0.001
-0.001
-53.49%
1 janv. 2000
0.001
0.0
-5.34%
1 janv. 2001
0.001
0.0
-38.18%
1 janv. 2002
0.001
0.0
-11.47%
1 janv. 2003
0.001
0.0
-5.51%
1 janv. 2004
0.001
+0.0
12.11%
1 janv. 2005
0.068
+0.068
10.55 milles%
1 janv. 2006
0.168
+0.099
145.3%
1 janv. 2007
0.242
+0.074
44.28%
1 janv. 2008
0.273
+0.032
13.04%
1 janv. 2009
0.624
+0.35
128.18%
1 janv. 2010
0.153
-0.47
-75.4%
1 janv. 2011
0.133
-0.021
-13.39%
1 janv. 2012
0.195
+0.062
46.93%
1 janv. 2013
0.156
-0.04
-20.34%
1 janv. 2014
0.253
+0.097
62.41%
1 janv. 2015
0.203
-0.049
-19.58%
Classement des pays selon les statistiques actuelles par années


Commentaires: