29
/fr/
fr
AIzaSyAYiBZKx7MnpbEhh9jyipgxe19OcubqV5w
April 1, 2024
221771
Peru
PER
true
2
1
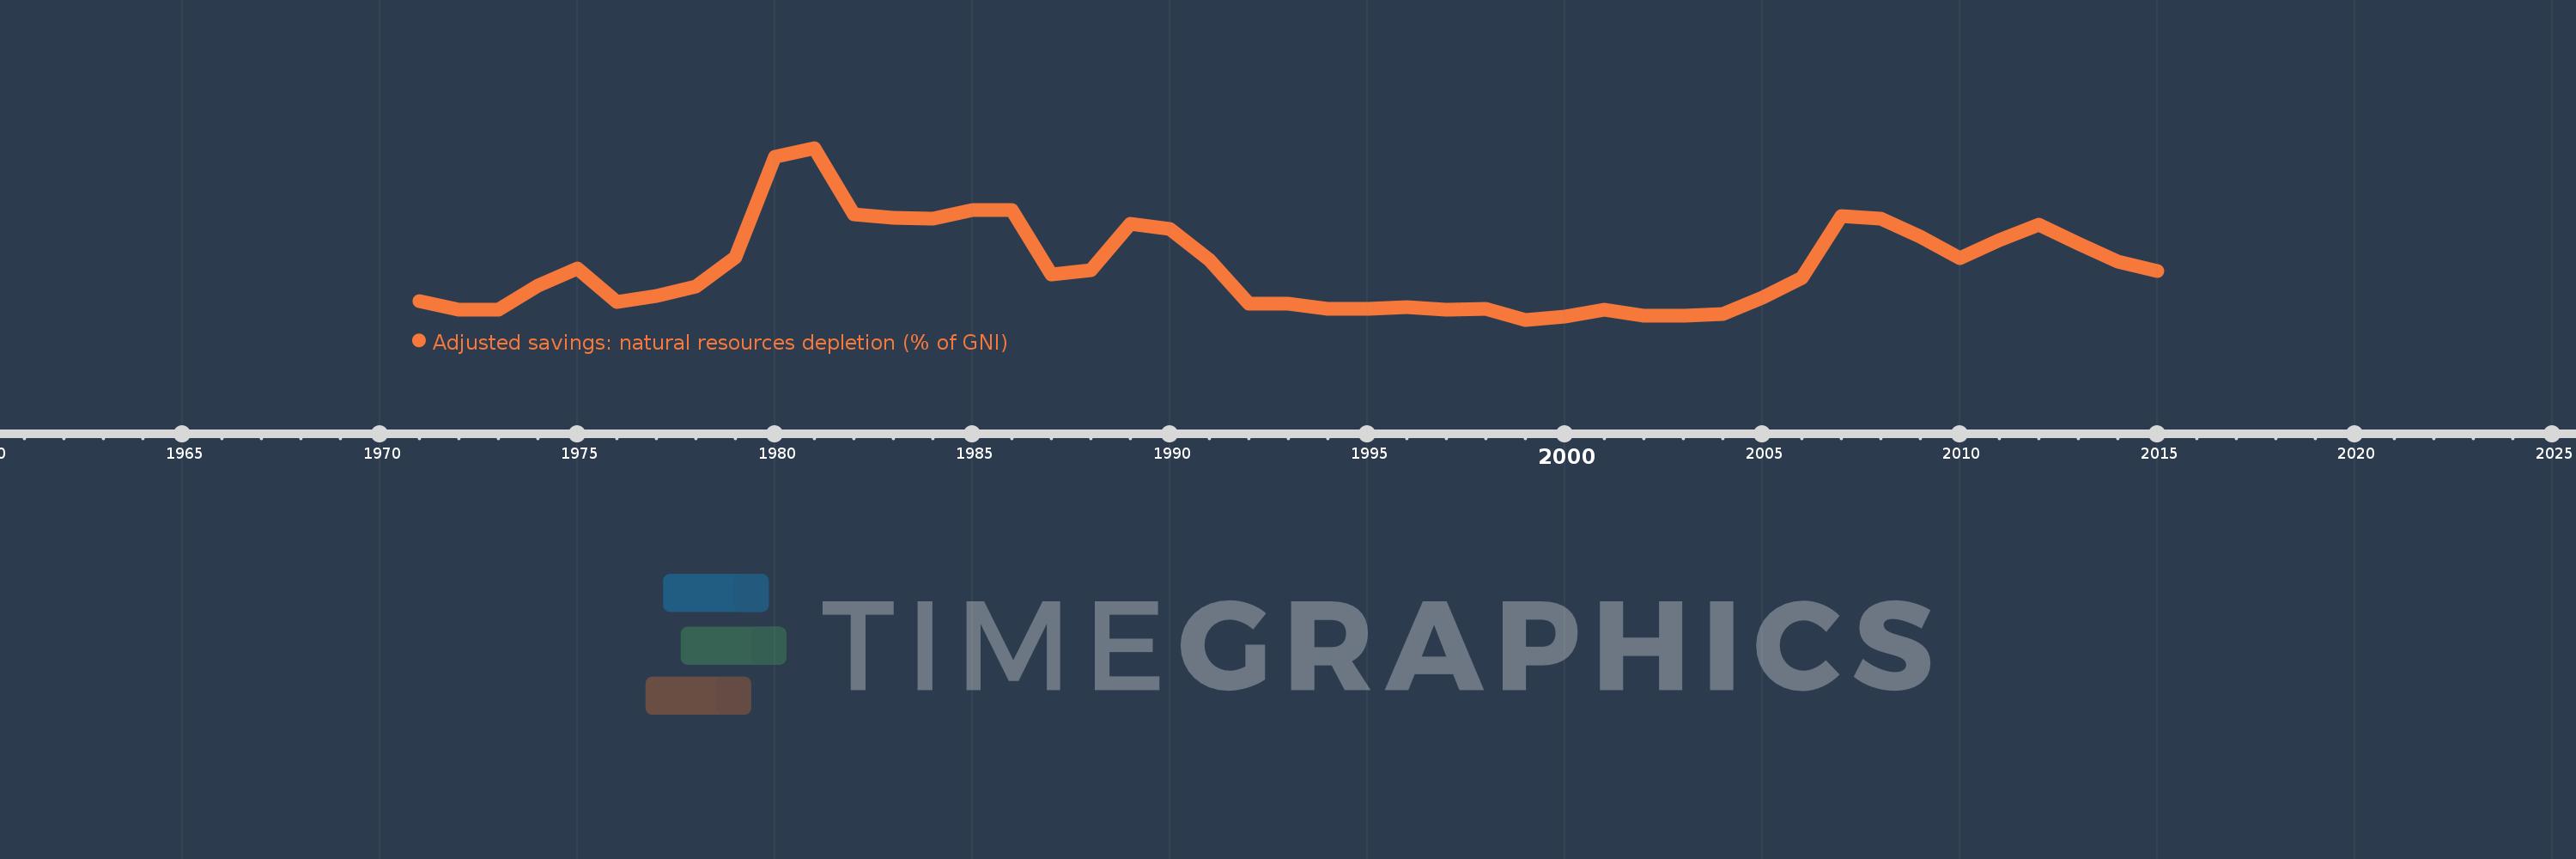
Adjusted savings: natural resources depletion (% of GNI)
2015,2014,2013,2012,2011,2010,2009,2008,2007,2006,2005,2004,2003,2002,2001,2000,1999,1998,1997,1996,1995,1994,1993,1992,1991,1990,1989,1988,1987,1986,1985,1984,1983,1982,1981,1980,1979,1978,1977,1976,1975,1974,1973,1972,1971
Cette statistique dans les autres pays:
AfghanistanAlbaniaAlgeriaAngolaArab WorldArgentinaArmeniaAustraliaAustriaAzerbaijanBahamas, TheBahrainBangladeshBarbadosBelarusBelgiumBelizeBeninBhutanBoliviaBotswanaBrazilBrunei DarussalamBulgariaBurkina FasoBurundiCabo VerdeCambodiaCameroonCanadaCaribbean small statesCentral African RepublicCentral Europe and the BalticsChadChileChinaColombiaComorosCongo, Dem. Rep.Congo, Rep.Costa RicaCote d'IvoireCroatiaCubaCyprusCzech RepublicDenmarkDjiboutiDominicaDominican RepublicEarly-demographic dividendEast Asia & PacificEast Asia & Pacific (excluding high income)East Asia & Pacific (IDA & IBRD countries)EcuadorEgypt, Arab Rep.El SalvadorEquatorial GuineaEritreaEstoniaEthiopiaEuro areaEurope & Central AsiaEurope & Central Asia (excluding high income)Europe & Central Asia (IDA & IBRD countries)European UnionFijiFinlandFragile and conflict affected situationsFranceFrench PolynesiaGabonGambia, TheGeorgiaGermanyGhanaGreeceGuatemalaGuineaGuinea-BissauGuyanaHaitiHeavily indebted poor countries (HIPC)High incomeHondurasHong Kong SAR, ChinaHungaryIBRD onlyIcelandIDA & IBRD totalIDA blendIDA onlyIDA totalIndiaIndonesiaIran, Islamic Rep.IraqIrelandIsraelItalyJamaicaJapanJordanKazakhstanKenyaKiribatiKorea, Rep.KuwaitKyrgyz RepublicLao PDRLate-demographic dividendLatin America & Caribbean Latin America & Caribbean (excluding high income)Latin America & the Caribbean (IDA & IBRD countries)LatviaLeast developed countries: UN classificationLebanonLesothoLiberiaLibyaLithuaniaLow & middle incomeLow incomeLower middle incomeLuxembourgMacedonia, FYRMadagascarMalawiMalaysiaMaldivesMaliMauritaniaMauritiusMexicoMicronesia, Fed. Sts.Middle East & North AfricaMiddle East & North Africa (excluding high income)Middle East & North Africa (IDA & IBRD countries)Middle incomeMoldovaMongoliaMoroccoMozambiqueMyanmarNamibiaNepalNetherlandsNew CaledoniaNew ZealandNicaraguaNigerNigeriaNorth AmericaNorwayOECD membersOmanOther small statesPacific island small statesPakistanPanamaPapua New GuineaParaguayPeruPhilippinesPolandPortugalPost-demographic dividendPre-demographic dividendQatarRomaniaRussian FederationRwandaSamoaSao Tome and PrincipeSaudi ArabiaSenegalSeychellesSierra LeoneSingaporeSlovak RepublicSloveniaSmall statesSolomon IslandsSomaliaSouth AfricaSouth AsiaSouth Asia (IDA & IBRD)SpainSri LankaSt. LuciaSt. Vincent and the GrenadinesSub-Saharan Africa Sub-Saharan Africa (excluding high income)Sub-Saharan Africa (IDA & IBRD countries)SudanSurinameSwazilandSwedenSwitzerlandSyrian Arab RepublicTajikistanTanzaniaThailandTogoTongaTrinidad and TobagoTunisiaTurkeyTurkmenistanUgandaUkraineUnited Arab EmiratesUnited KingdomUnited StatesUpper middle incomeUruguayUzbekistanVanuatuVenezuela, RBVietnamWorldYemen, Rep.ZambiaZimbabwe La ligne de temps
Cette échelle de temps montre un graphique de 1971 année à 2015 année Peru. Les données jusqu'à 1970 année ne sont pas présentés. Quantité d'observations actuelles selon dates: 45.
Source (désignation):
Les indicateurs du développement mondiale
Source (organisation):
World Bank staff estimates based on sources and methods in World Bank's "The Changing Wealth of Nations: Measuring Sustainable Development in the New Millennium" (2011).
Catégories:
Economy & Growth, Energy & Mining
Dernière mise à jour
23 avr. 2017
Les indicateurs de changement de valeurs selon les années
Maximum:
15.415
1 janv. 1981
Pour la date d''observation
Valeur
Changement absolu
Le changement par rapport à la valeur précédente
1 janv. 1971
2.133
+2.133
0.0%
1 janv. 1972
1.385
-0.749
-35.1%
1 janv. 1973
1.379
-0.005
-0.38%
1 janv. 1974
3.468
+2.088
151.39%
1 janv. 1975
4.958
+1.49
42.97%
1 janv. 1976
2.038
-2.92
-58.89%
1 janv. 1977
2.566
+0.528
25.92%
1 janv. 1978
3.389
+0.823
32.06%
1 janv. 1979
5.946
+2.557
75.45%
1 janv. 1980
14.644
+8.697
146.26%
1 janv. 1981
15.415
+0.772
5.27%
1 janv. 1982
9.67
-5.745
-37.27%
1 janv. 1983
9.362
-0.308
-3.19%
1 janv. 1984
9.288
-0.074
-0.79%
1 janv. 1985
10.001
+0.714
7.69%
1 janv. 1986
10.056
+0.055
0.55%
1 janv. 1987
4.434
-5.622
-55.91%
1 janv. 1988
4.8
+0.366
8.26%
1 janv. 1989
8.84
+4.04
84.16%
1 janv. 1990
8.429
-0.411
-4.65%
1 janv. 1991
5.739
-2.691
-31.92%
1 janv. 1992
1.936
-3.803
-66.27%
1 janv. 1993
1.909
-0.027
-1.38%
1 janv. 1994
1.46
-0.449
-23.53%
1 janv. 1995
1.443
-0.017
-1.16%
1 janv. 1996
1.622
+0.179
12.42%
1 janv. 1997
1.433
-0.19
-11.69%
1 janv. 1998
1.447
+0.015
1.02%
1 janv. 1999
0.53
-0.917
-63.34%
1 janv. 2000
0.801
+0.27
50.92%
1 janv. 2001
1.384
+0.583
72.86%
1 janv. 2002
0.88
-0.504
-36.42%
1 janv. 2003
0.859
-0.021
-2.38%
1 janv. 2004
1.058
+0.199
23.14%
1 janv. 2005
2.425
+1.368
129.29%
1 janv. 2006
4.14
+1.715
70.7%
1 janv. 2007
9.541
+5.401
130.47%
1 janv. 2008
9.298
-0.243
-2.55%
1 janv. 2009
7.727
-1.571
-16.9%
1 janv. 2010
5.861
-1.866
-24.15%
1 janv. 2011
7.404
+1.543
26.33%
1 janv. 2012
8.749
+1.346
18.17%
1 janv. 2013
7.138
-1.611
-18.42%
1 janv. 2014
5.54
-1.598
-22.39%
1 janv. 2015
4.759
-0.781
-14.09%
Classement des pays selon les statistiques actuelles par années


Commentaires: