29
/fr/
fr
AIzaSyAYiBZKx7MnpbEhh9jyipgxe19OcubqV5w
April 1, 2024
37913
IDA blend
IDB
false
2
1
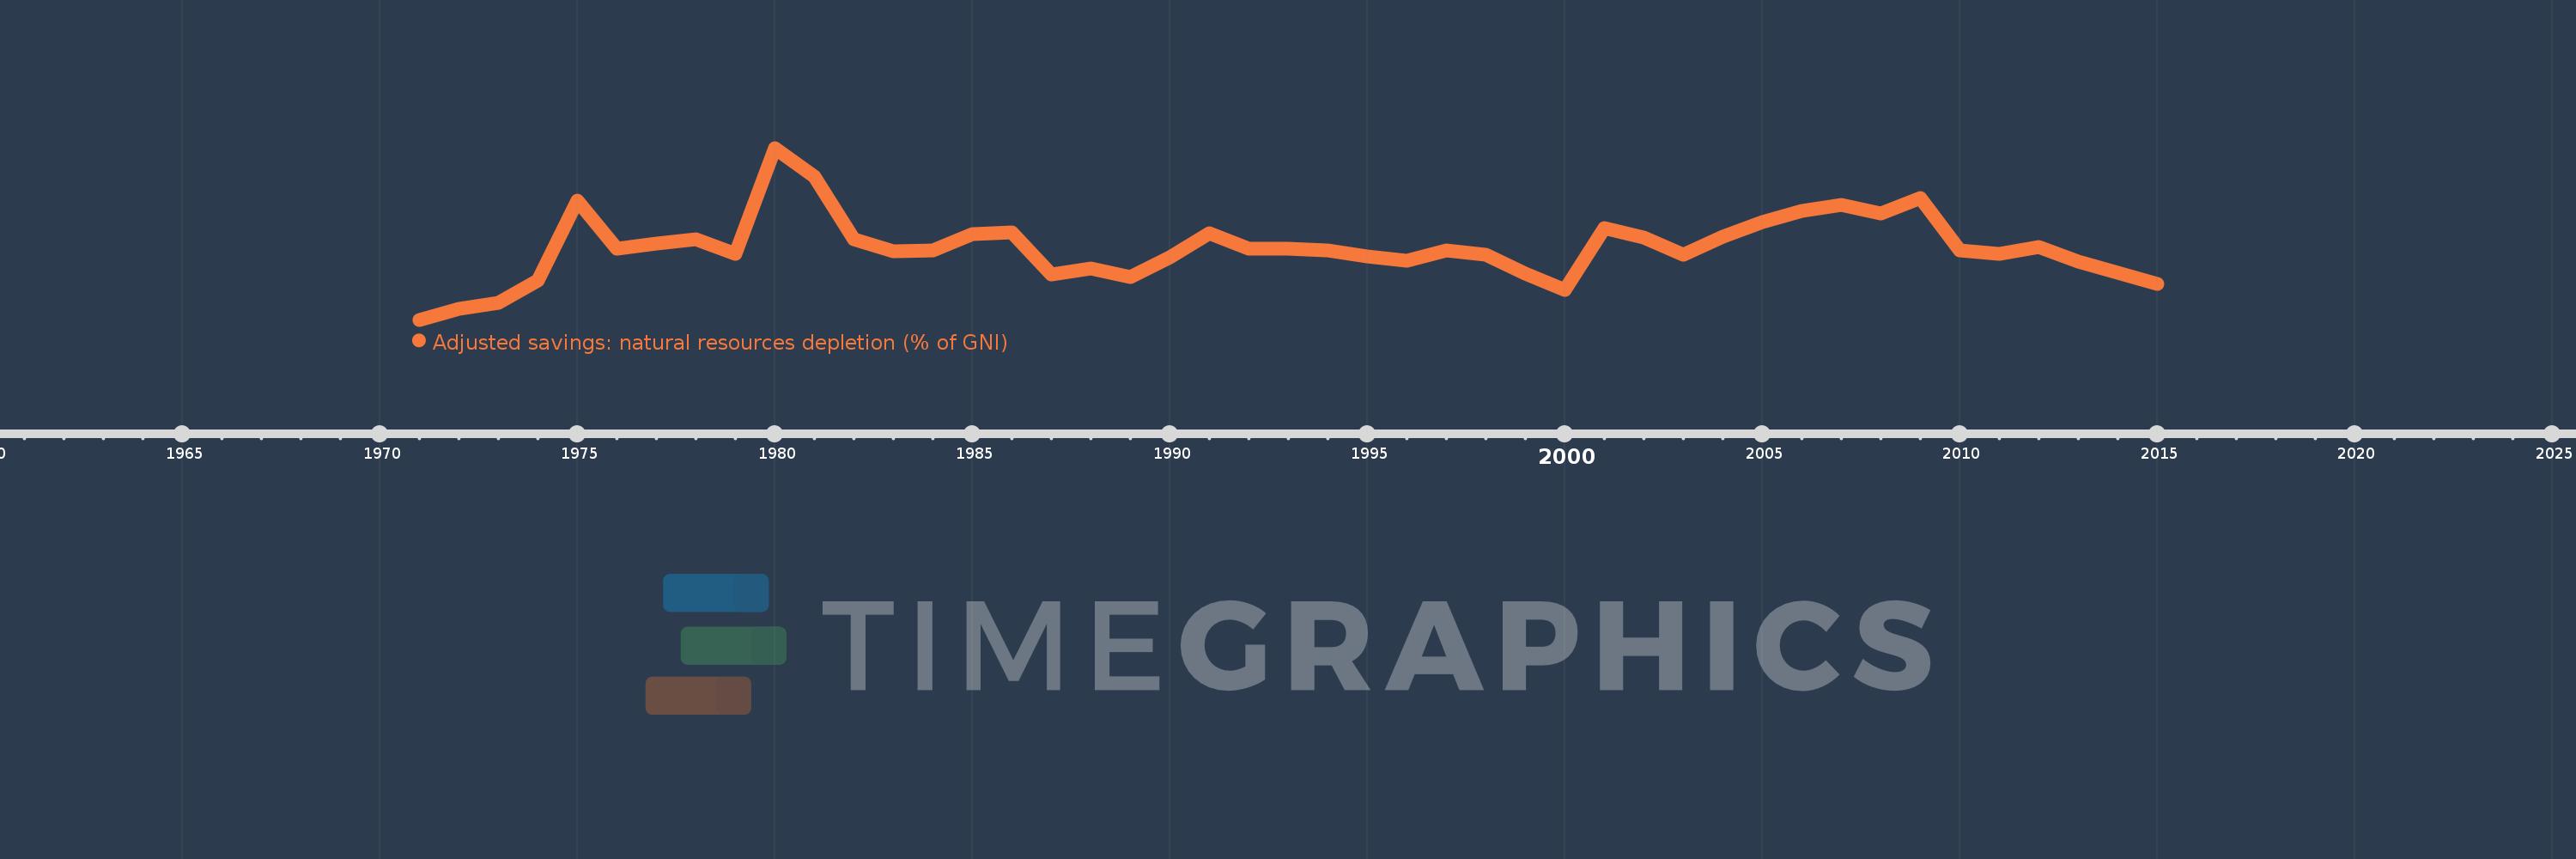
Adjusted savings: natural resources depletion (% of GNI)
2015,2014,2013,2012,2011,2010,2009,2008,2007,2006,2005,2004,2003,2002,2001,2000,1999,1998,1997,1996,1995,1994,1993,1992,1991,1990,1989,1988,1987,1986,1985,1984,1983,1982,1981,1980,1979,1978,1977,1976,1975,1974,1973,1972,1971
Cette statistique dans les autres pays:
AfghanistanAlbaniaAlgeriaAngolaArab WorldArgentinaArmeniaAustraliaAustriaAzerbaijanBahamas, TheBahrainBangladeshBarbadosBelarusBelgiumBelizeBeninBhutanBoliviaBotswanaBrazilBrunei DarussalamBulgariaBurkina FasoBurundiCabo VerdeCambodiaCameroonCanadaCaribbean small statesCentral African RepublicCentral Europe and the BalticsChadChileChinaColombiaComorosCongo, Dem. Rep.Congo, Rep.Costa RicaCote d'IvoireCroatiaCubaCyprusCzech RepublicDenmarkDjiboutiDominicaDominican RepublicEarly-demographic dividendEast Asia & PacificEast Asia & Pacific (excluding high income)East Asia & Pacific (IDA & IBRD countries)EcuadorEgypt, Arab Rep.El SalvadorEquatorial GuineaEritreaEstoniaEthiopiaEuro areaEurope & Central AsiaEurope & Central Asia (excluding high income)Europe & Central Asia (IDA & IBRD countries)European UnionFijiFinlandFragile and conflict affected situationsFranceFrench PolynesiaGabonGambia, TheGeorgiaGermanyGhanaGreeceGuatemalaGuineaGuinea-BissauGuyanaHaitiHeavily indebted poor countries (HIPC)High incomeHondurasHong Kong SAR, ChinaHungaryIBRD onlyIcelandIDA & IBRD totalIDA blendIDA onlyIDA totalIndiaIndonesiaIran, Islamic Rep.IraqIrelandIsraelItalyJamaicaJapanJordanKazakhstanKenyaKiribatiKorea, Rep.KuwaitKyrgyz RepublicLao PDRLate-demographic dividendLatin America & Caribbean Latin America & Caribbean (excluding high income)Latin America & the Caribbean (IDA & IBRD countries)LatviaLeast developed countries: UN classificationLebanonLesothoLiberiaLibyaLithuaniaLow & middle incomeLow incomeLower middle incomeLuxembourgMacedonia, FYRMadagascarMalawiMalaysiaMaldivesMaliMauritaniaMauritiusMexicoMicronesia, Fed. Sts.Middle East & North AfricaMiddle East & North Africa (excluding high income)Middle East & North Africa (IDA & IBRD countries)Middle incomeMoldovaMongoliaMoroccoMozambiqueMyanmarNamibiaNepalNetherlandsNew CaledoniaNew ZealandNicaraguaNigerNigeriaNorth AmericaNorwayOECD membersOmanOther small statesPacific island small statesPakistanPanamaPapua New GuineaParaguayPeruPhilippinesPolandPortugalPost-demographic dividendPre-demographic dividendQatarRomaniaRussian FederationRwandaSamoaSao Tome and PrincipeSaudi ArabiaSenegalSeychellesSierra LeoneSingaporeSlovak RepublicSloveniaSmall statesSolomon IslandsSomaliaSouth AfricaSouth AsiaSouth Asia (IDA & IBRD)SpainSri LankaSt. LuciaSt. Vincent and the GrenadinesSub-Saharan Africa Sub-Saharan Africa (excluding high income)Sub-Saharan Africa (IDA & IBRD countries)SudanSurinameSwazilandSwedenSwitzerlandSyrian Arab RepublicTajikistanTanzaniaThailandTogoTongaTrinidad and TobagoTunisiaTurkeyTurkmenistanUgandaUkraineUnited Arab EmiratesUnited KingdomUnited StatesUpper middle incomeUruguayUzbekistanVanuatuVenezuela, RBVietnamWorldYemen, Rep.ZambiaZimbabwe La ligne de temps
Cette échelle de temps montre un graphique de 1971 année à 2015 année IDA blend. Les données jusqu'à 1970 année ne sont pas présentés. Quantité d'observations actuelles selon dates: 45.
Source (désignation):
Les indicateurs du développement mondiale
Source (organisation):
World Bank staff estimates based on sources and methods in World Bank's "The Changing Wealth of Nations: Measuring Sustainable Development in the New Millennium" (2011).
Catégories:
Economy & Growth, Energy & Mining
Dernière mise à jour
23 avr. 2017
Les indicateurs de changement de valeurs selon les années
Minimum:
1.236
1 janv. 1971
Maximum:
22.204
1 janv. 1980
Pour la date d''observation
Valeur
Changement absolu
Le changement par rapport à la valeur précédente
1 janv. 1971
1.236
+1.236
0.0%
1 janv. 1972
2.568
+1.331
107.69%
1 janv. 1973
3.274
+0.706
27.49%
1 janv. 1974
6.003
+2.729
83.37%
1 janv. 1975
15.812
+9.81
163.42%
1 janv. 1976
9.917
-5.895
-37.28%
1 janv. 1977
10.502
+0.584
5.89%
1 janv. 1978
11.013
+0.512
4.87%
1 janv. 1979
9.283
-1.73
-15.71%
1 janv. 1980
22.204
+12.921
139.19%
1 janv. 1981
18.668
-3.537
-15.93%
1 janv. 1982
11.034
-7.633
-40.89%
1 janv. 1983
9.615
-1.419
-12.86%
1 janv. 1984
9.745
+0.13
1.35%
1 janv. 1985
11.666
+1.921
19.71%
1 janv. 1986
11.878
+0.212
1.82%
1 janv. 1987
6.752
-5.126
-43.16%
1 janv. 1988
7.509
+0.758
11.22%
1 janv. 1989
6.461
-1.048
-13.95%
1 janv. 1990
8.848
+2.387
36.94%
1 janv. 1991
11.779
+2.931
33.12%
1 janv. 1992
9.952
-1.827
-15.51%
1 janv. 1993
9.954
+0.002
0.02%
1 janv. 1994
9.65
-0.304
-3.06%
1 janv. 1995
8.965
-0.685
-7.1%
1 janv. 1996
8.445
-0.52
-5.8%
1 janv. 1997
9.655
+1.21
14.33%
1 janv. 1998
9.199
-0.456
-4.72%
1 janv. 1999
6.838
-2.361
-25.67%
1 janv. 2000
4.906
-1.931
-28.25%
1 janv. 2001
12.418
+7.511
153.1%
1 janv. 2002
11.225
-1.192
-9.6%
1 janv. 2003
9.223
-2.002
-17.84%
1 janv. 2004
11.395
+2.172
23.55%
1 janv. 2005
13.119
+1.724
15.13%
1 janv. 2006
14.508
+1.389
10.59%
1 janv. 2007
15.283
+0.775
5.34%
1 janv. 2008
14.188
-1.096
-7.17%
1 janv. 2009
16.065
+1.877
13.23%
1 janv. 2010
9.656
-6.409
-39.9%
1 janv. 2011
9.244
-0.412
-4.27%
1 janv. 2012
10.142
+0.898
9.72%
1 janv. 2013
8.284
-1.858
-18.32%
1 janv. 2014
7.005
-1.279
-15.44%
1 janv. 2015
5.588
-1.416
-20.22%
Classement des pays selon les statistiques actuelles par années


Commentaires: