29
/fr/
fr
AIzaSyAYiBZKx7MnpbEhh9jyipgxe19OcubqV5w
April 1, 2024
277304
Uruguay
URY
true
2
1
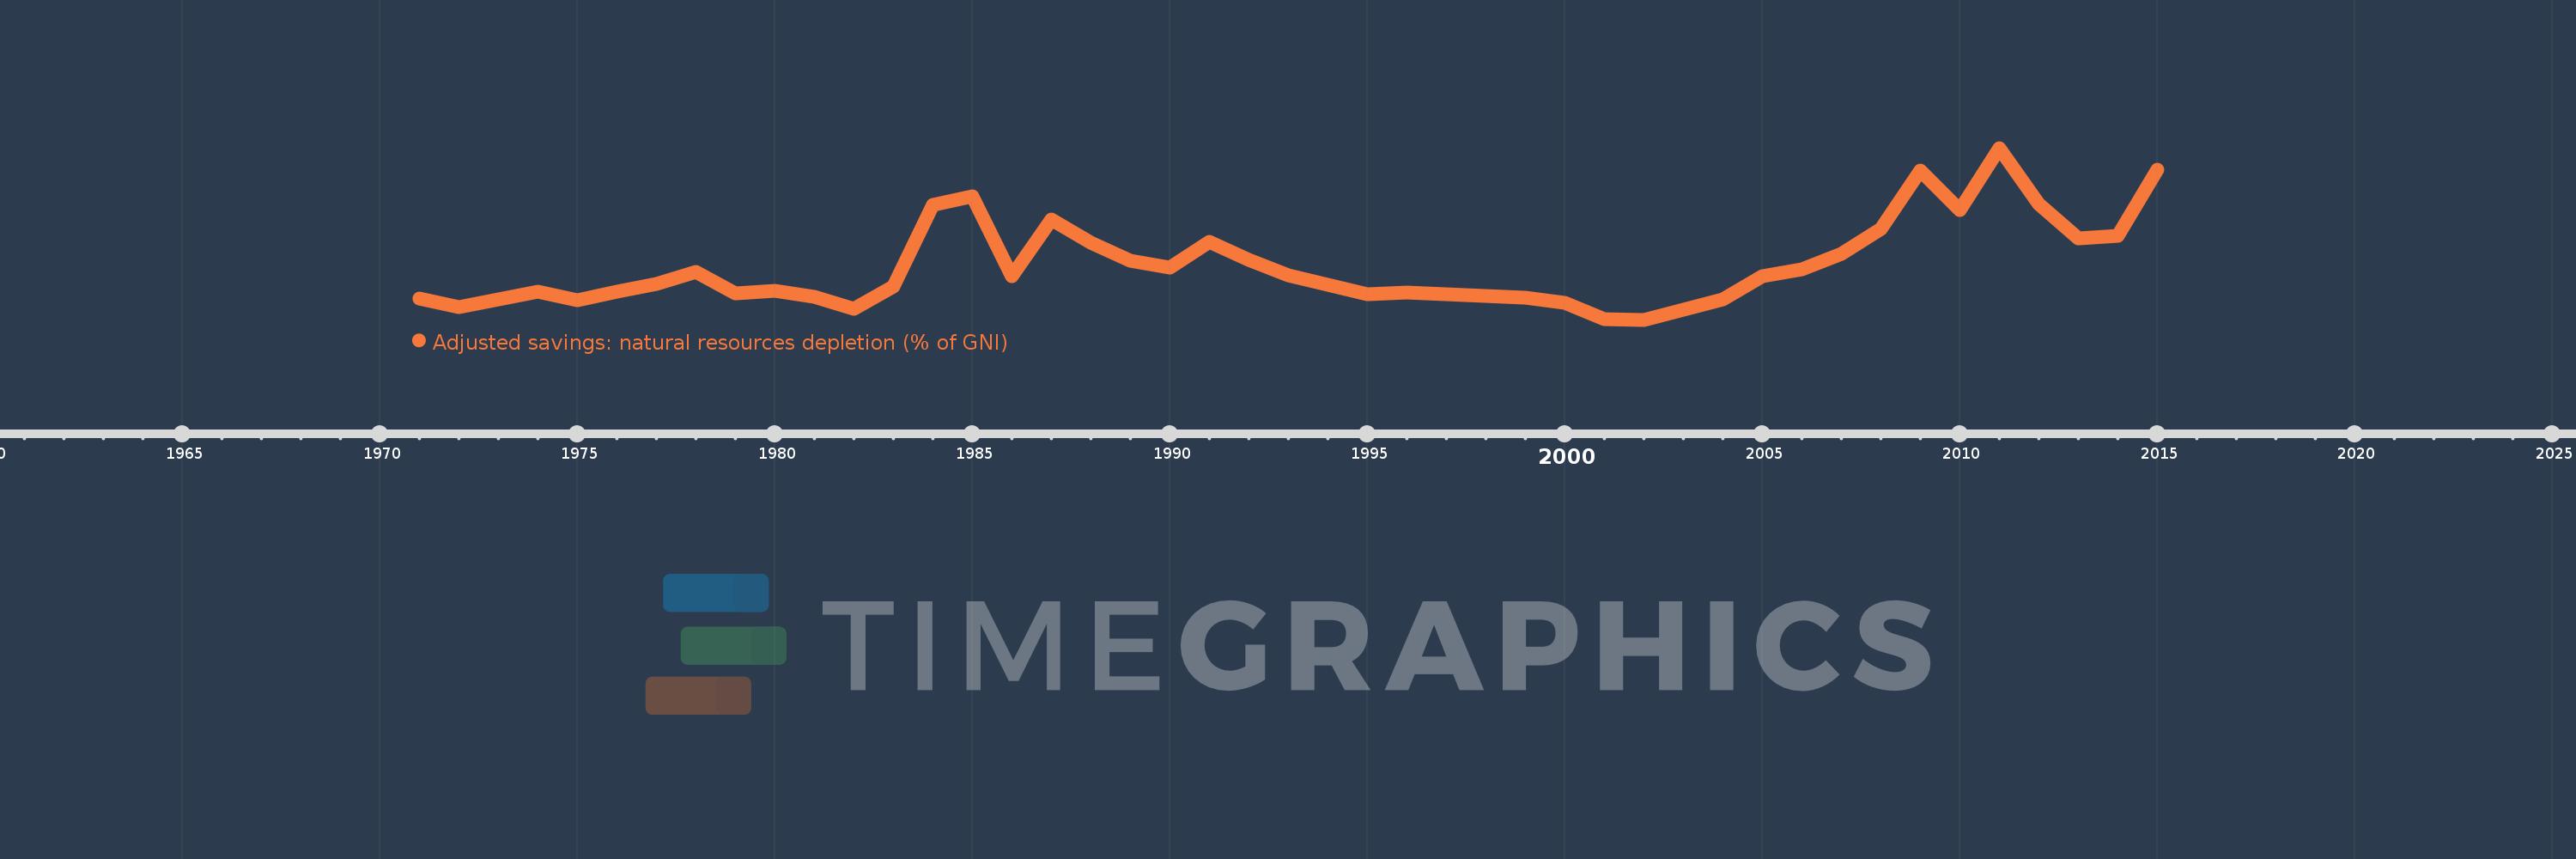
Adjusted savings: natural resources depletion (% of GNI)
2015,2014,2013,2012,2011,2010,2009,2008,2007,2006,2005,2004,2003,2002,2001,2000,1999,1998,1997,1996,1995,1994,1993,1992,1991,1990,1989,1988,1987,1986,1985,1984,1983,1982,1981,1980,1979,1978,1977,1976,1975,1974,1973,1972,1971
Cette statistique dans les autres pays:
AfghanistanAlbaniaAlgeriaAngolaArab WorldArgentinaArmeniaAustraliaAustriaAzerbaijanBahamas, TheBahrainBangladeshBarbadosBelarusBelgiumBelizeBeninBhutanBoliviaBotswanaBrazilBrunei DarussalamBulgariaBurkina FasoBurundiCabo VerdeCambodiaCameroonCanadaCaribbean small statesCentral African RepublicCentral Europe and the BalticsChadChileChinaColombiaComorosCongo, Dem. Rep.Congo, Rep.Costa RicaCote d'IvoireCroatiaCubaCyprusCzech RepublicDenmarkDjiboutiDominicaDominican RepublicEarly-demographic dividendEast Asia & PacificEast Asia & Pacific (excluding high income)East Asia & Pacific (IDA & IBRD countries)EcuadorEgypt, Arab Rep.El SalvadorEquatorial GuineaEritreaEstoniaEthiopiaEuro areaEurope & Central AsiaEurope & Central Asia (excluding high income)Europe & Central Asia (IDA & IBRD countries)European UnionFijiFinlandFragile and conflict affected situationsFranceFrench PolynesiaGabonGambia, TheGeorgiaGermanyGhanaGreeceGuatemalaGuineaGuinea-BissauGuyanaHaitiHeavily indebted poor countries (HIPC)High incomeHondurasHong Kong SAR, ChinaHungaryIBRD onlyIcelandIDA & IBRD totalIDA blendIDA onlyIDA totalIndiaIndonesiaIran, Islamic Rep.IraqIrelandIsraelItalyJamaicaJapanJordanKazakhstanKenyaKiribatiKorea, Rep.KuwaitKyrgyz RepublicLao PDRLate-demographic dividendLatin America & Caribbean Latin America & Caribbean (excluding high income)Latin America & the Caribbean (IDA & IBRD countries)LatviaLeast developed countries: UN classificationLebanonLesothoLiberiaLibyaLithuaniaLow & middle incomeLow incomeLower middle incomeLuxembourgMacedonia, FYRMadagascarMalawiMalaysiaMaldivesMaliMauritaniaMauritiusMexicoMicronesia, Fed. Sts.Middle East & North AfricaMiddle East & North Africa (excluding high income)Middle East & North Africa (IDA & IBRD countries)Middle incomeMoldovaMongoliaMoroccoMozambiqueMyanmarNamibiaNepalNetherlandsNew CaledoniaNew ZealandNicaraguaNigerNigeriaNorth AmericaNorwayOECD membersOmanOther small statesPacific island small statesPakistanPanamaPapua New GuineaParaguayPeruPhilippinesPolandPortugalPost-demographic dividendPre-demographic dividendQatarRomaniaRussian FederationRwandaSamoaSao Tome and PrincipeSaudi ArabiaSenegalSeychellesSierra LeoneSingaporeSlovak RepublicSloveniaSmall statesSolomon IslandsSomaliaSouth AfricaSouth AsiaSouth Asia (IDA & IBRD)SpainSri LankaSt. LuciaSt. Vincent and the GrenadinesSub-Saharan Africa Sub-Saharan Africa (excluding high income)Sub-Saharan Africa (IDA & IBRD countries)SudanSurinameSwazilandSwedenSwitzerlandSyrian Arab RepublicTajikistanTanzaniaThailandTogoTongaTrinidad and TobagoTunisiaTurkeyTurkmenistanUgandaUkraineUnited Arab EmiratesUnited KingdomUnited StatesUpper middle incomeUruguayUzbekistanVanuatuVenezuela, RBVietnamWorldYemen, Rep.ZambiaZimbabwe La ligne de temps
Cette échelle de temps montre un graphique de 1971 année à 2015 année Uruguay. Les données jusqu'à 1970 année ne sont pas présentés. Quantité d'observations actuelles selon dates: 45.
Source (désignation):
Les indicateurs du développement mondiale
Source (organisation):
World Bank staff estimates based on sources and methods in World Bank's "The Changing Wealth of Nations: Measuring Sustainable Development in the New Millennium" (2011).
Catégories:
Economy & Growth, Energy & Mining
Dernière mise à jour
23 avr. 2017
Les indicateurs de changement de valeurs selon les années
Minimum:
0.032
1 janv. 2002
Maximum:
2.925
1 janv. 2011
Pour la date d''observation
Valeur
Changement absolu
Le changement par rapport à la valeur précédente
1 janv. 1971
0.384
+0.384
0.0%
1 janv. 1972
0.242
-0.143
-37.11%
1 janv. 1973
0.376
+0.134
55.61%
1 janv. 1974
0.51
+0.134
35.76%
1 janv. 1975
0.361
-0.149
-29.28%
1 janv. 1976
0.503
+0.142
39.33%
1 janv. 1977
0.63
+0.128
25.36%
1 janv. 1978
0.844
+0.214
33.97%
1 janv. 1979
0.479
-0.365
-43.21%
1 janv. 1980
0.519
+0.039
8.22%
1 janv. 1981
0.415
-0.104
-20.04%
1 janv. 1982
0.209
-0.206
-49.72%
1 janv. 1983
0.598
+0.39
186.77%
1 janv. 1984
1.972
+1.374
229.61%
1 janv. 1985
2.116
+0.144
7.3%
1 janv. 1986
0.769
-1.347
-63.66%
1 janv. 1987
1.724
+0.955
124.21%
1 janv. 1988
1.333
-0.391
-22.69%
1 janv. 1989
1.032
-0.301
-22.55%
1 janv. 1990
0.905
-0.128
-12.39%
1 janv. 1991
1.346
+0.442
48.85%
1 janv. 1992
1.047
-0.3
-22.25%
1 janv. 1993
0.778
-0.269
-25.68%
1 janv. 1994
0.624
-0.154
-19.77%
1 janv. 1995
0.467
-0.157
-25.14%
1 janv. 1996
0.485
+0.017
3.73%
1 janv. 1997
0.466
-0.019
-3.86%
1 janv. 1998
0.426
-0.04
-8.57%
1 janv. 1999
0.408
-0.018
-4.19%
1 janv. 2000
0.321
-0.088
-21.47%
1 janv. 2001
0.035
-0.285
-88.98%
1 janv. 2002
0.032
-0.004
-10.09%
1 janv. 2003
0.196
+0.164
517.51%
1 janv. 2004
0.377
+0.181
92.07%
1 janv. 2005
0.767
+0.39
103.48%
1 janv. 2006
0.885
+0.118
15.41%
1 janv. 2007
1.144
+0.259
29.24%
1 janv. 2008
1.563
+0.42
36.69%
1 janv. 2009
2.545
+0.982
62.81%
1 janv. 2010
1.879
-0.666
-26.19%
1 janv. 2011
2.925
+1.047
55.7%
1 janv. 2012
1.982
-0.943
-32.24%
1 janv. 2013
1.402
-0.58
-29.27%
1 janv. 2014
1.446
+0.044
3.16%
1 janv. 2015
2.562
+1.115
77.12%
Classement des pays selon les statistiques actuelles par années


Commentaires: