29
/fr/
fr
AIzaSyAYiBZKx7MnpbEhh9jyipgxe19OcubqV5w
April 1, 2024
56003
Small states
SST
false
2
1
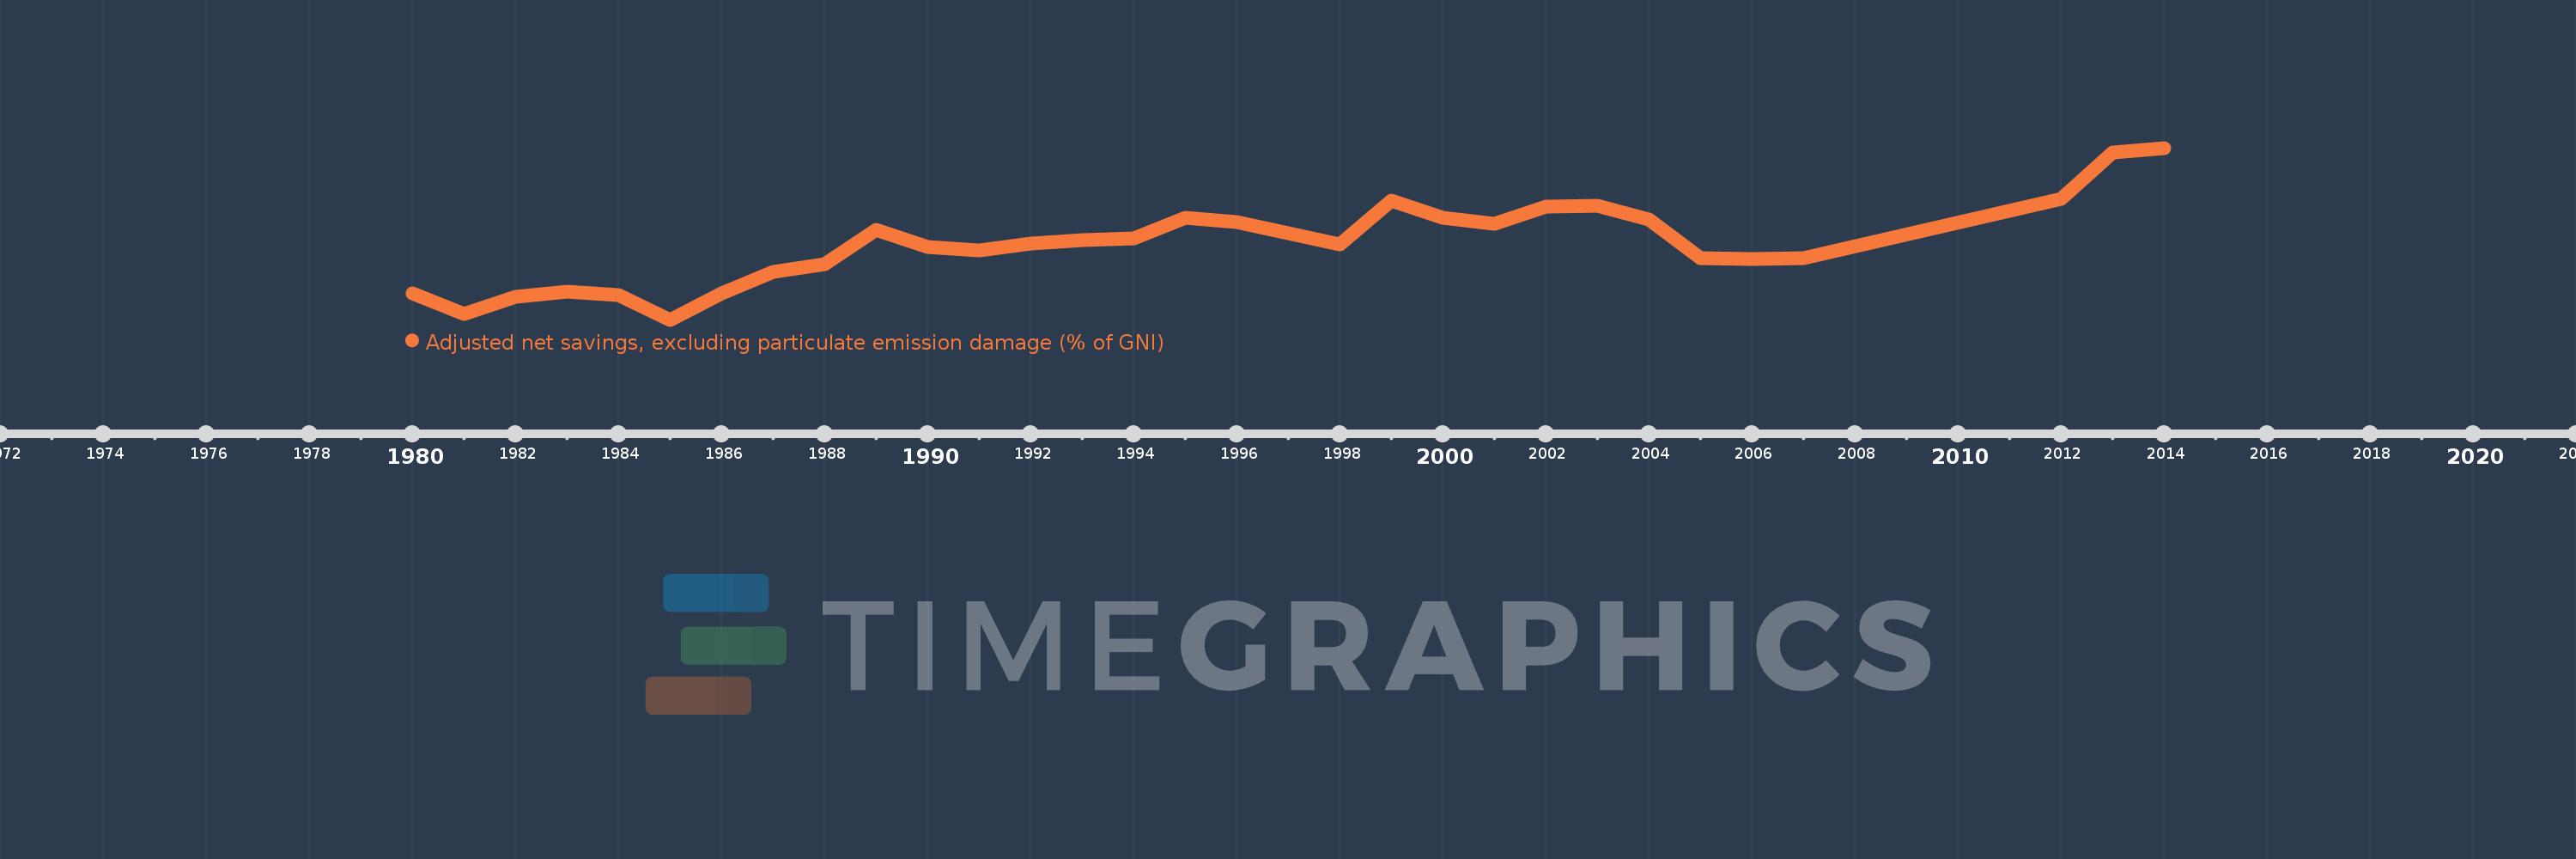
Adjusted net savings, excluding particulate emission damage (% of GNI)
2014,2013,2012,2007,2006,2005,2004,2003,2002,2001,2000,1999,1998,1997,1996,1995,1994,1993,1992,1991,1990,1989,1988,1987,1986,1985,1984,1983,1982,1981,1980
Cette statistique dans les autres pays:
AfghanistanAlbaniaAlgeriaAngolaArab WorldArgentinaArmeniaAustraliaAustriaAzerbaijanBahamas, TheBahrainBangladeshBarbadosBelarusBelgiumBelizeBeninBhutanBoliviaBotswanaBrazilBrunei DarussalamBulgariaBurkina FasoBurundiCabo VerdeCambodiaCameroonCanadaCaribbean small statesCentral African RepublicCentral Europe and the BalticsChadChileChinaColombiaComorosCongo, Dem. Rep.Congo, Rep.Costa RicaCote d'IvoireCroatiaCyprusCzech RepublicDenmarkDjiboutiDominicaDominican RepublicEarly-demographic dividendEast Asia & PacificEast Asia & Pacific (excluding high income)East Asia & Pacific (IDA & IBRD countries)EcuadorEgypt, Arab Rep.El SalvadorEquatorial GuineaEritreaEstoniaEthiopiaEuro areaEurope & Central AsiaEurope & Central Asia (excluding high income)Europe & Central Asia (IDA & IBRD countries)European UnionFijiFinlandFragile and conflict affected situationsFranceGabonGambia, TheGeorgiaGermanyGhanaGreeceGuatemalaGuineaGuinea-BissauGuyanaHaitiHeavily indebted poor countries (HIPC)High incomeHondurasHungaryIBRD onlyIcelandIDA & IBRD totalIDA blendIDA onlyIDA totalIndiaIndonesiaIran, Islamic Rep.IraqIrelandIsraelItalyJamaicaJapanJordanKazakhstanKenyaKiribatiKorea, Rep.KuwaitKyrgyz RepublicLao PDRLate-demographic dividendLatin America & Caribbean Latin America & Caribbean (excluding high income)Latin America & the Caribbean (IDA & IBRD countries)LatviaLeast developed countries: UN classificationLebanonLesothoLiberiaLibyaLithuaniaLow & middle incomeLow incomeLower middle incomeLuxembourgMacedonia, FYRMadagascarMalawiMalaysiaMaldivesMaliMauritaniaMauritiusMexicoMiddle East & North AfricaMiddle East & North Africa (excluding high income)Middle East & North Africa (IDA & IBRD countries)Middle incomeMoldovaMongoliaMoroccoMozambiqueNamibiaNepalNetherlandsNew ZealandNicaraguaNigerNigeriaNorth AmericaNorwayOECD membersOmanOther small statesPacific island small statesPakistanPanamaPapua New GuineaParaguayPeruPhilippinesPolandPortugalPost-demographic dividendPre-demographic dividendQatarRomaniaRussian FederationRwandaSaudi ArabiaSenegalSeychellesSierra LeoneSingaporeSlovak RepublicSloveniaSmall statesSolomon IslandsSouth AfricaSouth AsiaSouth Asia (IDA & IBRD)SpainSri LankaSt. LuciaSt. Vincent and the GrenadinesSub-Saharan Africa Sub-Saharan Africa (excluding high income)Sub-Saharan Africa (IDA & IBRD countries)SudanSurinameSwazilandSwedenSwitzerlandSyrian Arab RepublicTajikistanTanzaniaThailandTogoTongaTrinidad and TobagoTunisiaTurkeyUgandaUkraineUnited KingdomUnited StatesUpper middle incomeUruguayVanuatuVenezuela, RBVietnamWorldYemen, Rep.ZambiaZimbabwe La ligne de temps
Cette échelle de temps montre un graphique de 1980 année à 2014 année Small states. Les données jusqu'à 1979 année ne sont pas présentés. Quantité d'observations actuelles selon dates: 31.
Source (désignation):
Les indicateurs du développement mondiale
Source (organisation):
World Bank staff estimates based on sources and methods in World Bank's "The Changing Wealth of Nations: Measuring Sustainable Development in the New Millennium" (2011).
Catégories:
Economy & Growth, Environment
Dernière mise à jour
23 avr. 2017
Les indicateurs de changement de valeurs selon les années
Minimum:
-1.887
1 janv. 1985
Maximum:
16.811
1 janv. 2014
Pour la date d''observation
Valeur
Changement absolu
Le changement par rapport à la valeur précédente
1 janv. 1980
0.977
+0.977
0.0%
1 janv. 1981
-1.216
-2.193
-224.44%
1 janv. 1982
0.571
+1.788
-146.99%
1 janv. 1983
1.168
+0.596
104.33%
1 janv. 1984
0.803
-0.365
-31.22%
1 janv. 1985
-1.887
-2.691
-335.0%
1 janv. 1986
0.937
+2.825
-149.66%
1 janv. 1987
3.296
+2.359
251.65%
1 janv. 1988
4.192
+0.896
27.2%
1 janv. 1989
7.859
+3.667
87.47%
1 janv. 1990
6.077
-1.782
-22.68%
1 janv. 1991
5.658
-0.419
-6.89%
1 janv. 1992
6.435
+0.776
13.72%
1 janv. 1993
6.807
+0.372
5.78%
1 janv. 1994
6.994
+0.187
2.74%
1 janv. 1995
9.181
+2.187
31.27%
1 janv. 1996
8.739
-0.442
-4.81%
1 janv. 1997
7.519
-1.22
-13.97%
1 janv. 1998
6.287
-1.232
-16.39%
1 janv. 1999
11.098
+4.811
76.53%
1 janv. 2000
9.251
-1.847
-16.64%
1 janv. 2001
8.569
-0.682
-7.37%
1 janv. 2002
10.438
+1.869
21.82%
1 janv. 2003
10.534
+0.096
0.92%
1 janv. 2004
9.053
-1.481
-14.06%
1 janv. 2005
4.828
-4.224
-46.66%
1 janv. 2006
4.742
-0.086
-1.79%
1 janv. 2007
4.855
+0.113
2.38%
1 janv. 2012
11.311
+6.456
132.98%
1 janv. 2013
16.314
+5.004
44.24%
1 janv. 2014
16.811
+0.497
3.05%
Classement des pays selon les statistiques actuelles par années


Commentaires: