29
/fr/
fr
AIzaSyAYiBZKx7MnpbEhh9jyipgxe19OcubqV5w
April 1, 2024
42060
Latin America & Caribbean (excluding high income)
LAC
false
2
1
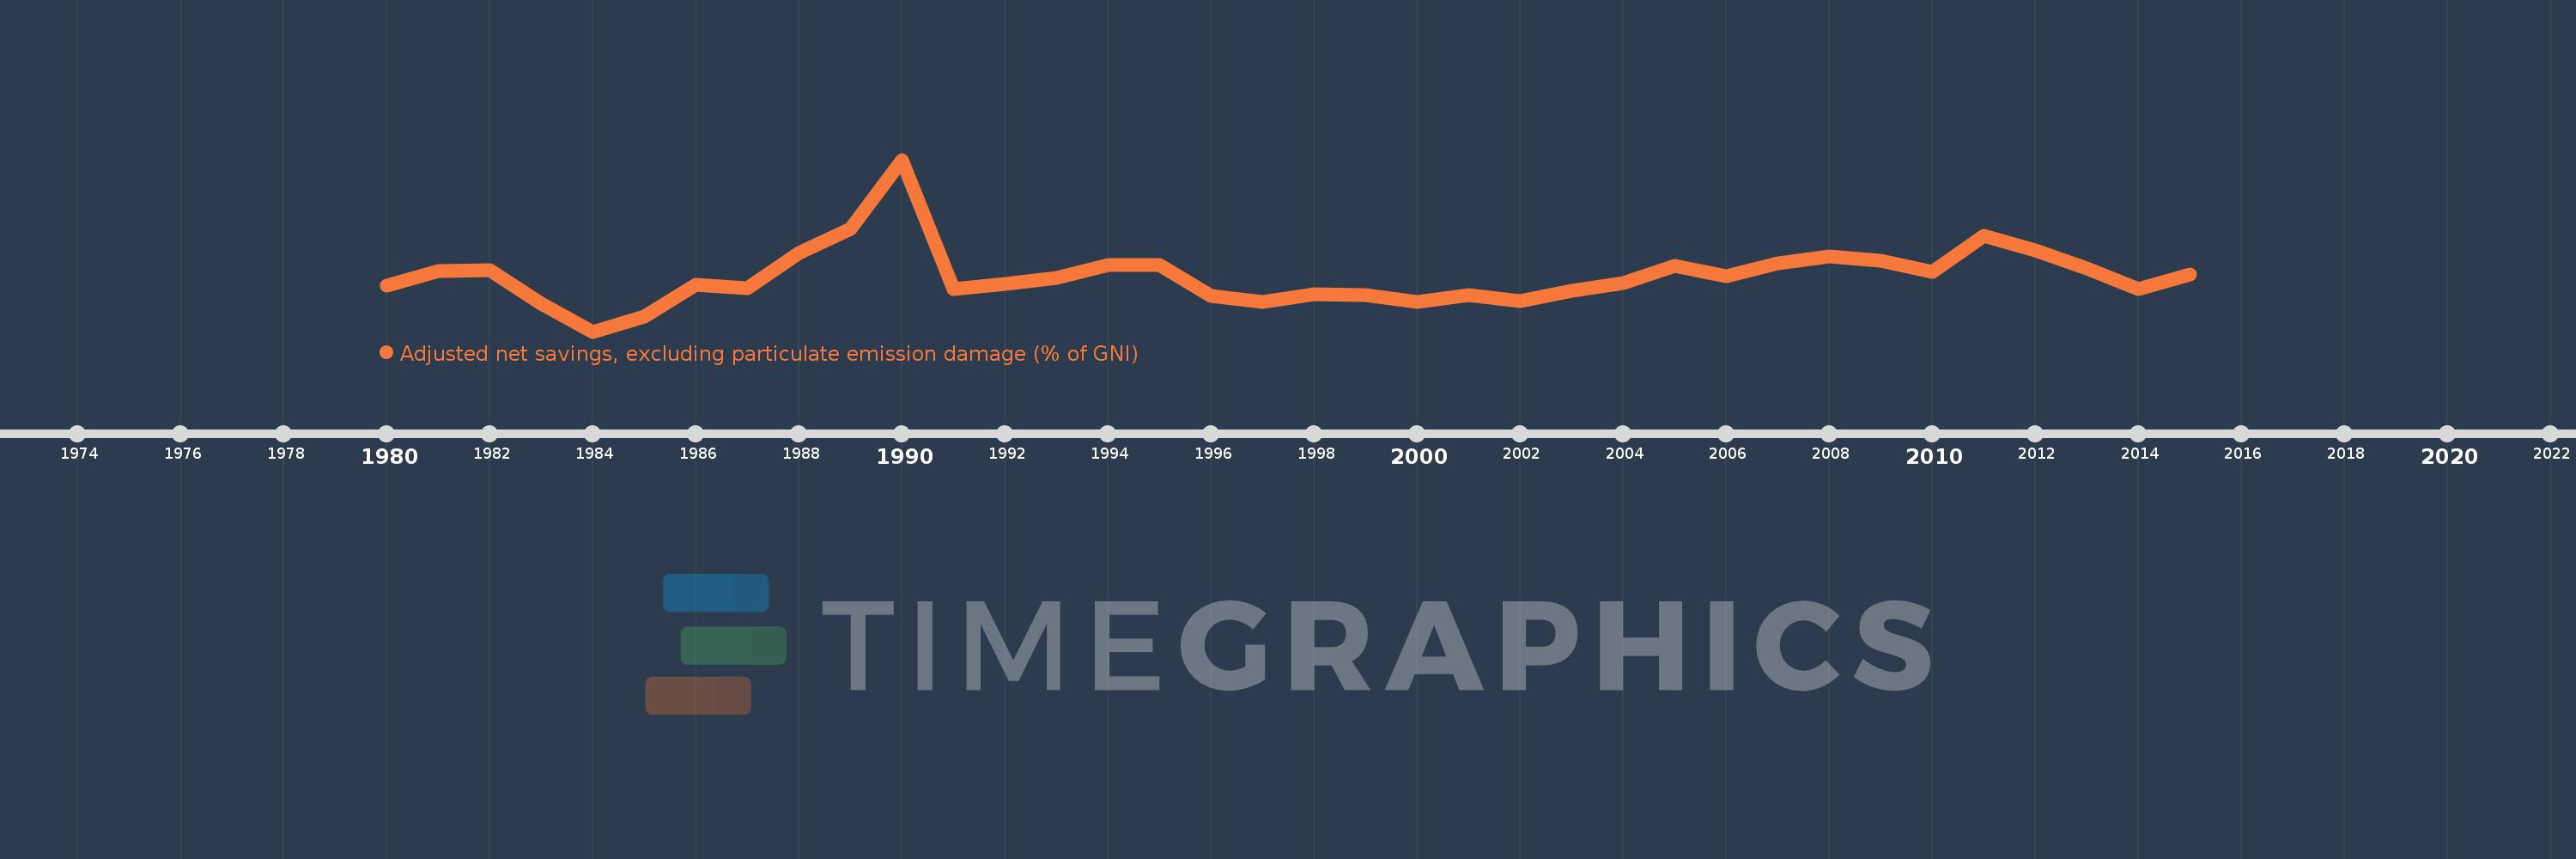
Adjusted net savings, excluding particulate emission damage (% of GNI)
2015,2014,2013,2012,2011,2010,2009,2008,2007,2006,2005,2004,2003,2002,2001,2000,1999,1998,1997,1996,1995,1994,1993,1992,1991,1990,1989,1988,1987,1986,1985,1984,1983,1982,1981,1980
Cette statistique dans les autres pays:
AfghanistanAlbaniaAlgeriaAngolaArab WorldArgentinaArmeniaAustraliaAustriaAzerbaijanBahamas, TheBahrainBangladeshBarbadosBelarusBelgiumBelizeBeninBhutanBoliviaBotswanaBrazilBrunei DarussalamBulgariaBurkina FasoBurundiCabo VerdeCambodiaCameroonCanadaCaribbean small statesCentral African RepublicCentral Europe and the BalticsChadChileChinaColombiaComorosCongo, Dem. Rep.Congo, Rep.Costa RicaCote d'IvoireCroatiaCyprusCzech RepublicDenmarkDjiboutiDominicaDominican RepublicEarly-demographic dividendEast Asia & PacificEast Asia & Pacific (excluding high income)East Asia & Pacific (IDA & IBRD countries)EcuadorEgypt, Arab Rep.El SalvadorEquatorial GuineaEritreaEstoniaEthiopiaEuro areaEurope & Central AsiaEurope & Central Asia (excluding high income)Europe & Central Asia (IDA & IBRD countries)European UnionFijiFinlandFragile and conflict affected situationsFranceGabonGambia, TheGeorgiaGermanyGhanaGreeceGuatemalaGuineaGuinea-BissauGuyanaHaitiHeavily indebted poor countries (HIPC)High incomeHondurasHungaryIBRD onlyIcelandIDA & IBRD totalIDA blendIDA onlyIDA totalIndiaIndonesiaIran, Islamic Rep.IraqIrelandIsraelItalyJamaicaJapanJordanKazakhstanKenyaKiribatiKorea, Rep.KuwaitKyrgyz RepublicLao PDRLate-demographic dividendLatin America & Caribbean Latin America & Caribbean (excluding high income)Latin America & the Caribbean (IDA & IBRD countries)LatviaLeast developed countries: UN classificationLebanonLesothoLiberiaLibyaLithuaniaLow & middle incomeLow incomeLower middle incomeLuxembourgMacedonia, FYRMadagascarMalawiMalaysiaMaldivesMaliMauritaniaMauritiusMexicoMiddle East & North AfricaMiddle East & North Africa (excluding high income)Middle East & North Africa (IDA & IBRD countries)Middle incomeMoldovaMongoliaMoroccoMozambiqueNamibiaNepalNetherlandsNew ZealandNicaraguaNigerNigeriaNorth AmericaNorwayOECD membersOmanOther small statesPacific island small statesPakistanPanamaPapua New GuineaParaguayPeruPhilippinesPolandPortugalPost-demographic dividendPre-demographic dividendQatarRomaniaRussian FederationRwandaSaudi ArabiaSenegalSeychellesSierra LeoneSingaporeSlovak RepublicSloveniaSmall statesSolomon IslandsSouth AfricaSouth AsiaSouth Asia (IDA & IBRD)SpainSri LankaSt. LuciaSt. Vincent and the GrenadinesSub-Saharan Africa Sub-Saharan Africa (excluding high income)Sub-Saharan Africa (IDA & IBRD countries)SudanSurinameSwazilandSwedenSwitzerlandSyrian Arab RepublicTajikistanTanzaniaThailandTogoTongaTrinidad and TobagoTunisiaTurkeyUgandaUkraineUnited KingdomUnited StatesUpper middle incomeUruguayVanuatuVenezuela, RBVietnamWorldYemen, Rep.ZambiaZimbabwe La ligne de temps
Cette échelle de temps montre un graphique de 1980 année à 2015 année Latin America & Caribbean (excluding high income). Les données jusqu'à 1979 année ne sont pas présentés. Quantité d'observations actuelles selon dates: 36.
Source (désignation):
Les indicateurs du développement mondiale
Source (organisation):
World Bank staff estimates based on sources and methods in World Bank's "The Changing Wealth of Nations: Measuring Sustainable Development in the New Millennium" (2011).
Catégories:
Economy & Growth, Environment
Dernière mise à jour
23 avr. 2017
Les indicateurs de changement de valeurs selon les années
Minimum:
3.782
1 janv. 1984
Maximum:
16.871
1 janv. 1990
Pour la date d''observation
Valeur
Changement absolu
Le changement par rapport à la valeur précédente
1 janv. 1980
7.292
+7.292
0.0%
1 janv. 1981
8.4
+1.108
15.19%
1 janv. 1982
8.435
+0.035
0.42%
1 janv. 1983
5.931
-2.504
-29.68%
1 janv. 1984
3.782
-2.149
-36.24%
1 janv. 1985
4.93
+1.148
30.35%
1 janv. 1986
7.333
+2.403
48.75%
1 janv. 1987
7.055
-0.278
-3.79%
1 janv. 1988
9.752
+2.697
38.22%
1 janv. 1989
11.579
+1.827
18.73%
1 janv. 1990
16.871
+5.292
45.71%
1 janv. 1991
7.027
-9.844
-58.35%
1 janv. 1992
7.382
+0.355
5.05%
1 janv. 1993
7.88
+0.498
6.74%
1 janv. 1994
8.864
+0.984
12.49%
1 janv. 1995
8.851
-0.013
-0.15%
1 janv. 1996
6.491
-2.36
-26.67%
1 janv. 1997
6.046
-0.445
-6.86%
1 janv. 1998
6.607
+0.561
9.28%
1 janv. 1999
6.585
-0.022
-0.33%
1 janv. 2000
6.037
-0.548
-8.32%
1 janv. 2001
6.54
+0.502
8.32%
1 janv. 2002
6.085
-0.455
-6.96%
1 janv. 2003
6.879
+0.794
13.05%
1 janv. 2004
7.496
+0.617
8.97%
1 janv. 2005
8.786
+1.291
17.22%
1 janv. 2006
7.981
-0.805
-9.16%
1 janv. 2007
8.975
+0.993
12.45%
1 janv. 2008
9.496
+0.522
5.81%
1 janv. 2009
9.159
-0.338
-3.56%
1 janv. 2010
8.32
-0.839
-9.16%
1 janv. 2011
11.058
+2.738
32.91%
1 janv. 2012
9.934
-1.124
-10.16%
1 janv. 2013
8.607
-1.328
-13.36%
1 janv. 2014
7.004
-1.603
-18.62%
1 janv. 2015
8.124
+1.12
15.99%
Classement des pays selon les statistiques actuelles par années


Commentaires: