29
/fr/
fr
AIzaSyAYiBZKx7MnpbEhh9jyipgxe19OcubqV5w
April 1, 2024
27043
East Asia & Pacific
EAS
false
2
1
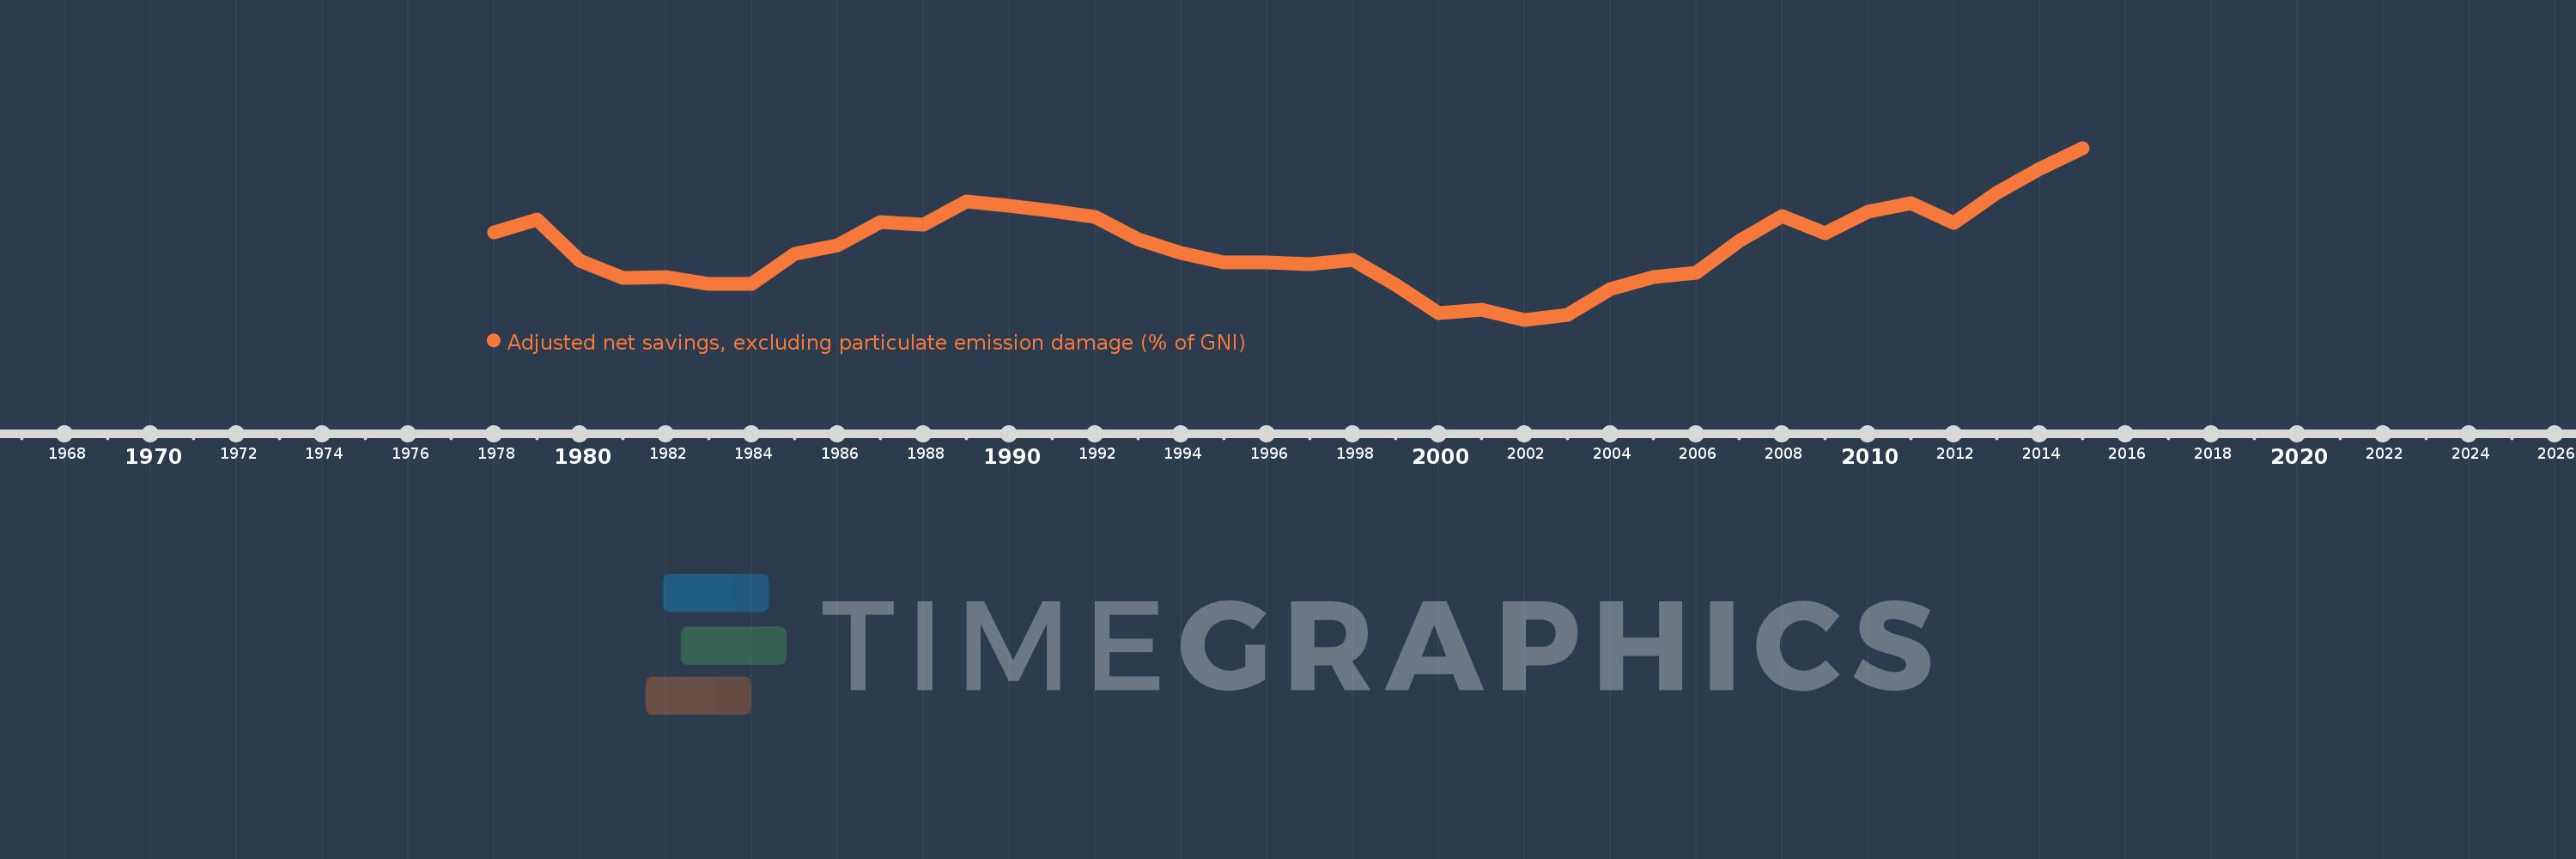
Adjusted net savings, excluding particulate emission damage (% of GNI)
2015,2014,2013,2012,2011,2010,2009,2008,2007,2006,2005,2004,2003,2002,2001,2000,1999,1998,1997,1996,1995,1994,1993,1992,1991,1990,1989,1988,1987,1986,1985,1984,1983,1982,1981,1980,1979,1978
Cette statistique dans les autres pays:
AfghanistanAlbaniaAlgeriaAngolaArab WorldArgentinaArmeniaAustraliaAustriaAzerbaijanBahamas, TheBahrainBangladeshBarbadosBelarusBelgiumBelizeBeninBhutanBoliviaBotswanaBrazilBrunei DarussalamBulgariaBurkina FasoBurundiCabo VerdeCambodiaCameroonCanadaCaribbean small statesCentral African RepublicCentral Europe and the BalticsChadChileChinaColombiaComorosCongo, Dem. Rep.Congo, Rep.Costa RicaCote d'IvoireCroatiaCyprusCzech RepublicDenmarkDjiboutiDominicaDominican RepublicEarly-demographic dividendEast Asia & PacificEast Asia & Pacific (excluding high income)East Asia & Pacific (IDA & IBRD countries)EcuadorEgypt, Arab Rep.El SalvadorEquatorial GuineaEritreaEstoniaEthiopiaEuro areaEurope & Central AsiaEurope & Central Asia (excluding high income)Europe & Central Asia (IDA & IBRD countries)European UnionFijiFinlandFragile and conflict affected situationsFranceGabonGambia, TheGeorgiaGermanyGhanaGreeceGuatemalaGuineaGuinea-BissauGuyanaHaitiHeavily indebted poor countries (HIPC)High incomeHondurasHungaryIBRD onlyIcelandIDA & IBRD totalIDA blendIDA onlyIDA totalIndiaIndonesiaIran, Islamic Rep.IraqIrelandIsraelItalyJamaicaJapanJordanKazakhstanKenyaKiribatiKorea, Rep.KuwaitKyrgyz RepublicLao PDRLate-demographic dividendLatin America & Caribbean Latin America & Caribbean (excluding high income)Latin America & the Caribbean (IDA & IBRD countries)LatviaLeast developed countries: UN classificationLebanonLesothoLiberiaLibyaLithuaniaLow & middle incomeLow incomeLower middle incomeLuxembourgMacedonia, FYRMadagascarMalawiMalaysiaMaldivesMaliMauritaniaMauritiusMexicoMiddle East & North AfricaMiddle East & North Africa (excluding high income)Middle East & North Africa (IDA & IBRD countries)Middle incomeMoldovaMongoliaMoroccoMozambiqueNamibiaNepalNetherlandsNew ZealandNicaraguaNigerNigeriaNorth AmericaNorwayOECD membersOmanOther small statesPacific island small statesPakistanPanamaPapua New GuineaParaguayPeruPhilippinesPolandPortugalPost-demographic dividendPre-demographic dividendQatarRomaniaRussian FederationRwandaSaudi ArabiaSenegalSeychellesSierra LeoneSingaporeSlovak RepublicSloveniaSmall statesSolomon IslandsSouth AfricaSouth AsiaSouth Asia (IDA & IBRD)SpainSri LankaSt. LuciaSt. Vincent and the GrenadinesSub-Saharan Africa Sub-Saharan Africa (excluding high income)Sub-Saharan Africa (IDA & IBRD countries)SudanSurinameSwazilandSwedenSwitzerlandSyrian Arab RepublicTajikistanTanzaniaThailandTogoTongaTrinidad and TobagoTunisiaTurkeyUgandaUkraineUnited KingdomUnited StatesUpper middle incomeUruguayVanuatuVenezuela, RBVietnamWorldYemen, Rep.ZambiaZimbabwe La ligne de temps
Cette échelle de temps montre un graphique de 1978 année à 2015 année East Asia & Pacific. Les données jusqu'à 1977 année ne sont pas présentés. Quantité d'observations actuelles selon dates: 38.
Source (désignation):
Les indicateurs du développement mondiale
Source (organisation):
World Bank staff estimates based on sources and methods in World Bank's "The Changing Wealth of Nations: Measuring Sustainable Development in the New Millennium" (2011).
Catégories:
Economy & Growth, Environment
Dernière mise à jour
23 avr. 2017
Les indicateurs de changement de valeurs selon les années
Maximum:
23.051
1 janv. 2015
Pour la date d''observation
Valeur
Changement absolu
Le changement par rapport à la valeur précédente
1 janv. 1978
18.213
+18.213
0.0%
1 janv. 1979
18.971
+0.759
4.17%
1 janv. 1980
16.607
-2.364
-12.46%
1 janv. 1981
15.608
-0.999
-6.02%
1 janv. 1982
15.657
+0.049
0.31%
1 janv. 1983
15.277
-0.38
-2.43%
1 janv. 1984
15.236
-0.041
-0.27%
1 janv. 1985
16.981
+1.745
11.45%
1 janv. 1986
17.476
+0.495
2.92%
1 janv. 1987
18.799
+1.323
7.57%
1 janv. 1988
18.673
-0.126
-0.67%
1 janv. 1989
19.997
+1.323
7.09%
1 janv. 1990
19.717
-0.28
-1.4%
1 janv. 1991
19.441
-0.275
-1.4%
1 janv. 1992
19.109
-0.332
-1.71%
1 janv. 1993
17.811
-1.298
-6.79%
1 janv. 1994
17.025
-0.787
-4.42%
1 janv. 1995
16.508
-0.517
-3.04%
1 janv. 1996
16.466
-0.042
-0.25%
1 janv. 1997
16.363
-0.103
-0.63%
1 janv. 1998
16.635
+0.272
1.66%
1 janv. 1999
15.21
-1.425
-8.56%
1 janv. 2000
13.555
-1.655
-10.88%
1 janv. 2001
13.767
+0.212
1.56%
1 janv. 2002
13.2
-0.567
-4.12%
1 janv. 2003
13.504
+0.304
2.3%
1 janv. 2004
14.968
+1.464
10.84%
1 janv. 2005
15.625
+0.658
4.39%
1 janv. 2006
15.9
+0.275
1.76%
1 janv. 2007
17.719
+1.818
11.44%
1 janv. 2008
19.164
+1.446
8.16%
1 janv. 2009
18.178
-0.987
-5.15%
1 janv. 2010
19.4
+1.222
6.72%
1 janv. 2011
19.9
+0.5
2.58%
1 janv. 2012
18.754
-1.147
-5.76%
1 janv. 2013
20.482
+1.728
9.22%
1 janv. 2014
21.87
+1.387
6.77%
1 janv. 2015
23.051
+1.181
5.4%
Classement des pays selon les statistiques actuelles par années


Commentaires: