29
/fr/
fr
AIzaSyAYiBZKx7MnpbEhh9jyipgxe19OcubqV5w
April 1, 2024
163462
Japan
JPN
true
2
1
Adjusted net savings, excluding particulate emission damage (% of GNI)
2015,2014,2013,2012,2011,2010,2009,2008,2007,2006,2005,2004,2003,2002,2001,2000,1999,1998,1997,1996,1995,1994,1993,1992,1991,1990,1989,1988,1987,1986,1985,1984,1983,1982,1981,1980,1979,1978
Cette statistique dans les autres pays:
AfghanistanAlbaniaAlgeriaAngolaArab WorldArgentinaArmeniaAustraliaAustriaAzerbaijanBahamas, TheBahrainBangladeshBarbadosBelarusBelgiumBelizeBeninBhutanBoliviaBotswanaBrazilBrunei DarussalamBulgariaBurkina FasoBurundiCabo VerdeCambodiaCameroonCanadaCaribbean small statesCentral African RepublicCentral Europe and the BalticsChadChileChinaColombiaComorosCongo, Dem. Rep.Congo, Rep.Costa RicaCote d'IvoireCroatiaCyprusCzech RepublicDenmarkDjiboutiDominicaDominican RepublicEarly-demographic dividendEast Asia & PacificEast Asia & Pacific (excluding high income)East Asia & Pacific (IDA & IBRD countries)EcuadorEgypt, Arab Rep.El SalvadorEquatorial GuineaEritreaEstoniaEthiopiaEuro areaEurope & Central AsiaEurope & Central Asia (excluding high income)Europe & Central Asia (IDA & IBRD countries)European UnionFijiFinlandFragile and conflict affected situationsFranceGabonGambia, TheGeorgiaGermanyGhanaGreeceGuatemalaGuineaGuinea-BissauGuyanaHaitiHeavily indebted poor countries (HIPC)High incomeHondurasHungaryIBRD onlyIcelandIDA & IBRD totalIDA blendIDA onlyIDA totalIndiaIndonesiaIran, Islamic Rep.IraqIrelandIsraelItalyJamaicaJapanJordanKazakhstanKenyaKiribatiKorea, Rep.KuwaitKyrgyz RepublicLao PDRLate-demographic dividendLatin America & Caribbean Latin America & Caribbean (excluding high income)Latin America & the Caribbean (IDA & IBRD countries)LatviaLeast developed countries: UN classificationLebanonLesothoLiberiaLibyaLithuaniaLow & middle incomeLow incomeLower middle incomeLuxembourgMacedonia, FYRMadagascarMalawiMalaysiaMaldivesMaliMauritaniaMauritiusMexicoMiddle East & North AfricaMiddle East & North Africa (excluding high income)Middle East & North Africa (IDA & IBRD countries)Middle incomeMoldovaMongoliaMoroccoMozambiqueNamibiaNepalNetherlandsNew ZealandNicaraguaNigerNigeriaNorth AmericaNorwayOECD membersOmanOther small statesPacific island small statesPakistanPanamaPapua New GuineaParaguayPeruPhilippinesPolandPortugalPost-demographic dividendPre-demographic dividendQatarRomaniaRussian FederationRwandaSaudi ArabiaSenegalSeychellesSierra LeoneSingaporeSlovak RepublicSloveniaSmall statesSolomon IslandsSouth AfricaSouth AsiaSouth Asia (IDA & IBRD)SpainSri LankaSt. LuciaSt. Vincent and the GrenadinesSub-Saharan Africa Sub-Saharan Africa (excluding high income)Sub-Saharan Africa (IDA & IBRD countries)SudanSurinameSwazilandSwedenSwitzerlandSyrian Arab RepublicTajikistanTanzaniaThailandTogoTongaTrinidad and TobagoTunisiaTurkeyUgandaUkraineUnited KingdomUnited StatesUpper middle incomeUruguayVanuatuVenezuela, RBVietnamWorldYemen, Rep.ZambiaZimbabwe La ligne de temps
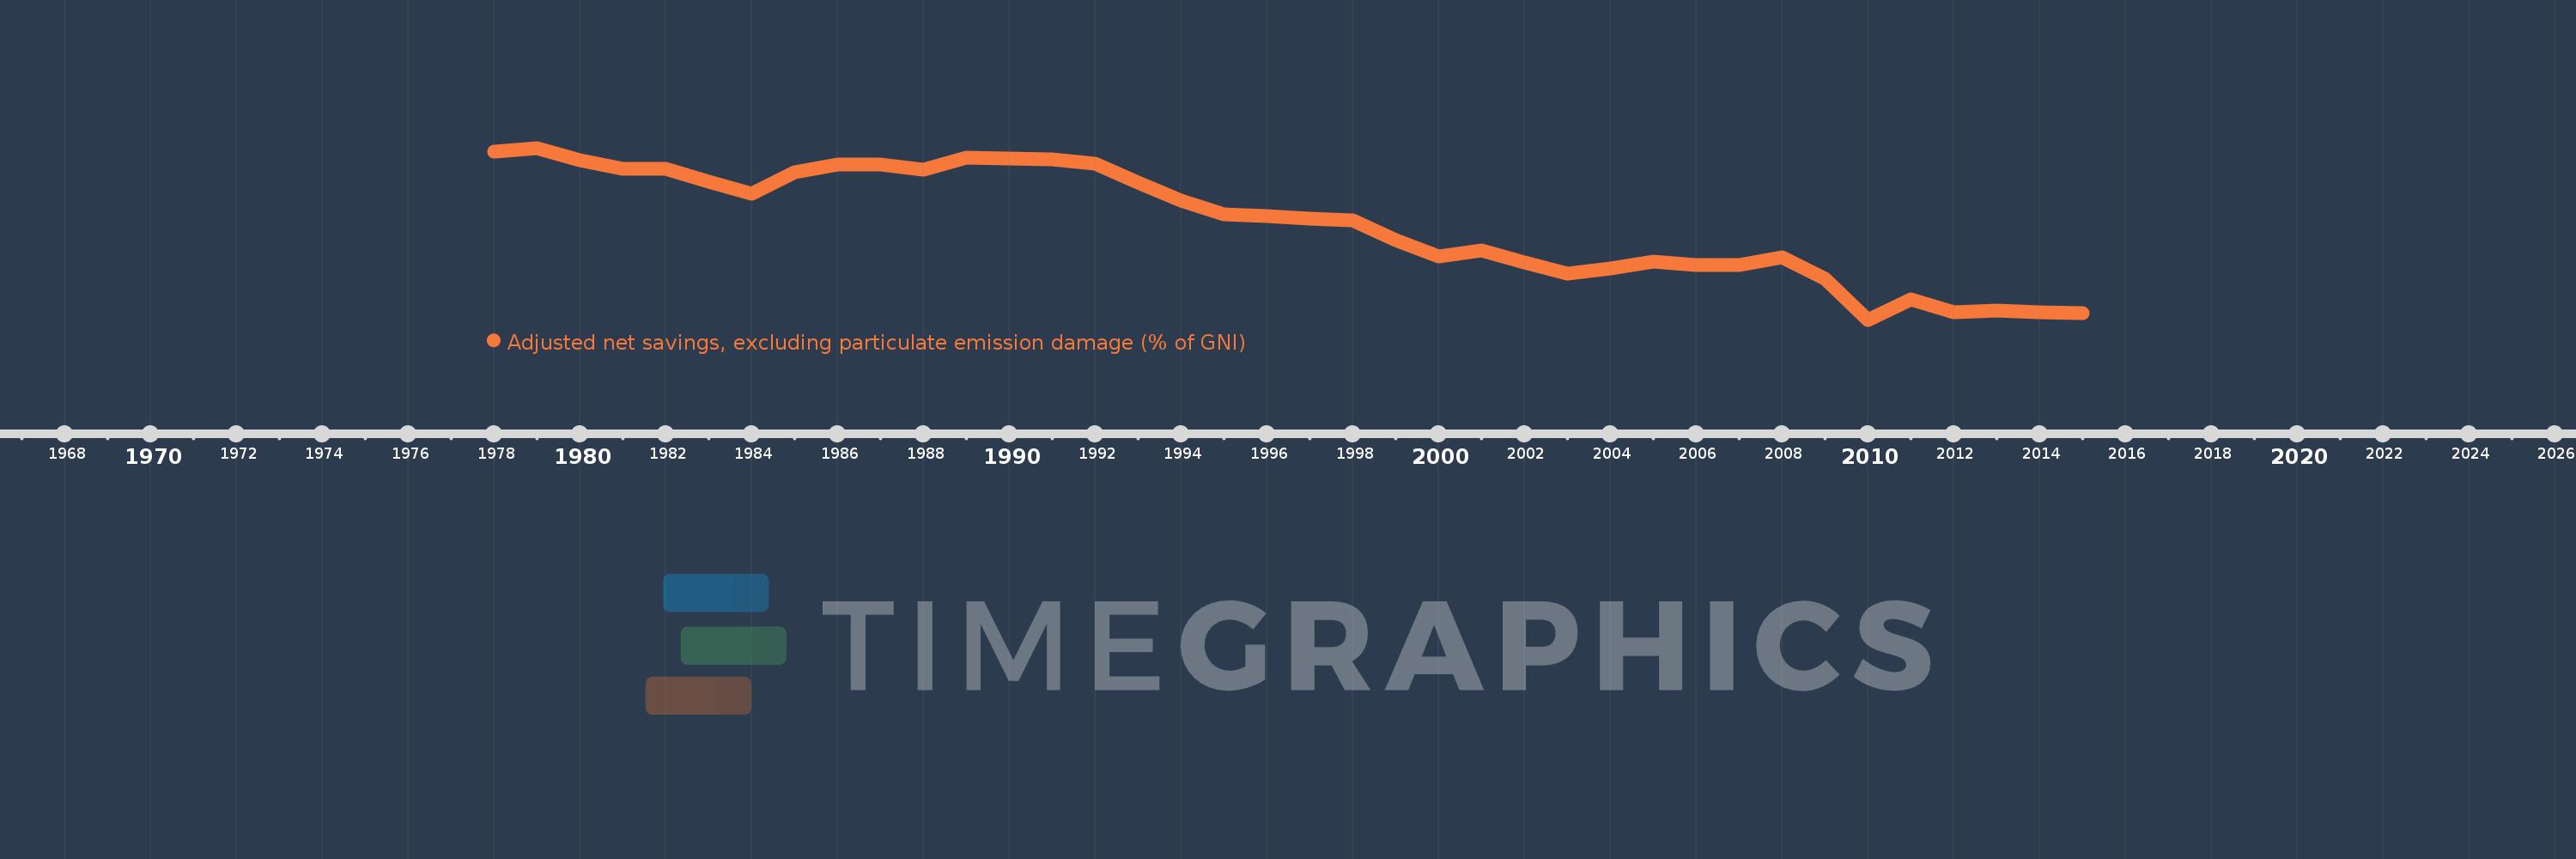
Cette échelle de temps montre un graphique de 1978 année à 2015 année Japan. Les données jusqu'à 1977 année ne sont pas présentés. Quantité d'observations actuelles selon dates: 38.
Source (désignation):
Les indicateurs du développement mondiale
Source (organisation):
World Bank staff estimates based on sources and methods in World Bank's "The Changing Wealth of Nations: Measuring Sustainable Development in the New Millennium" (2011).
Catégories:
Economy & Growth, Environment
Dernière mise à jour
23 avr. 2017
Les indicateurs de changement de valeurs selon les années
Minimum:
2.745
1 janv. 2010
Maximum:
21.288
1 janv. 1979
Pour la date d''observation
Valeur
Changement absolu
Le changement par rapport à la valeur précédente
1 janv. 1978
20.876
+20.876
0.0%
1 janv. 1979
21.288
+0.412
1.98%
1 janv. 1980
19.972
-1.316
-6.18%
1 janv. 1981
19.073
-0.898
-4.5%
1 janv. 1982
19.044
-0.029
-0.15%
1 janv. 1983
17.619
-1.425
-7.48%
1 janv. 1984
16.385
-1.234
-7.01%
1 janv. 1985
18.619
+2.235
13.64%
1 janv. 1986
19.52
+0.9
4.83%
1 janv. 1987
19.512
-0.007
-0.04%
1 janv. 1988
18.925
-0.587
-3.01%
1 janv. 1989
20.209
+1.283
6.78%
1 janv. 1990
20.13
-0.079
-0.39%
1 janv. 1991
20.045
-0.085
-0.42%
1 janv. 1992
19.581
-0.464
-2.31%
1 janv. 1993
17.545
-2.036
-10.4%
1 janv. 1994
15.576
-1.969
-11.22%
1 janv. 1995
14.114
-1.462
-9.39%
1 janv. 1996
13.941
-0.173
-1.22%
1 janv. 1997
13.692
-0.249
-1.79%
1 janv. 1998
13.45
-0.243
-1.77%
1 janv. 1999
11.296
-2.154
-16.01%
1 janv. 2000
9.596
-1.699
-15.04%
1 janv. 2001
10.242
+0.646
6.73%
1 janv. 2002
8.931
-1.311
-12.8%
1 janv. 2003
7.729
-1.201
-13.45%
1 janv. 2004
8.277
+0.548
7.09%
1 janv. 2005
9.01
+0.733
8.86%
1 janv. 2006
8.658
-0.353
-3.91%
1 janv. 2007
8.662
+0.004
0.05%
1 janv. 2008
9.502
+0.84
9.7%
1 janv. 2009
7.139
-2.363
-24.87%
1 janv. 2010
2.745
-4.394
-61.55%
1 janv. 2011
4.902
+2.158
78.61%
1 janv. 2012
3.562
-1.34
-27.33%
1 janv. 2013
3.736
+0.174
4.88%
1 janv. 2014
3.557
-0.18
-4.81%
1 janv. 2015
3.477
-0.08
-2.24%
Classement des pays selon les statistiques actuelles par années


Commentaires: