29
/fr/
fr
AIzaSyAYiBZKx7MnpbEhh9jyipgxe19OcubqV5w
April 1, 2024
133796
France
FRA
true
2
1
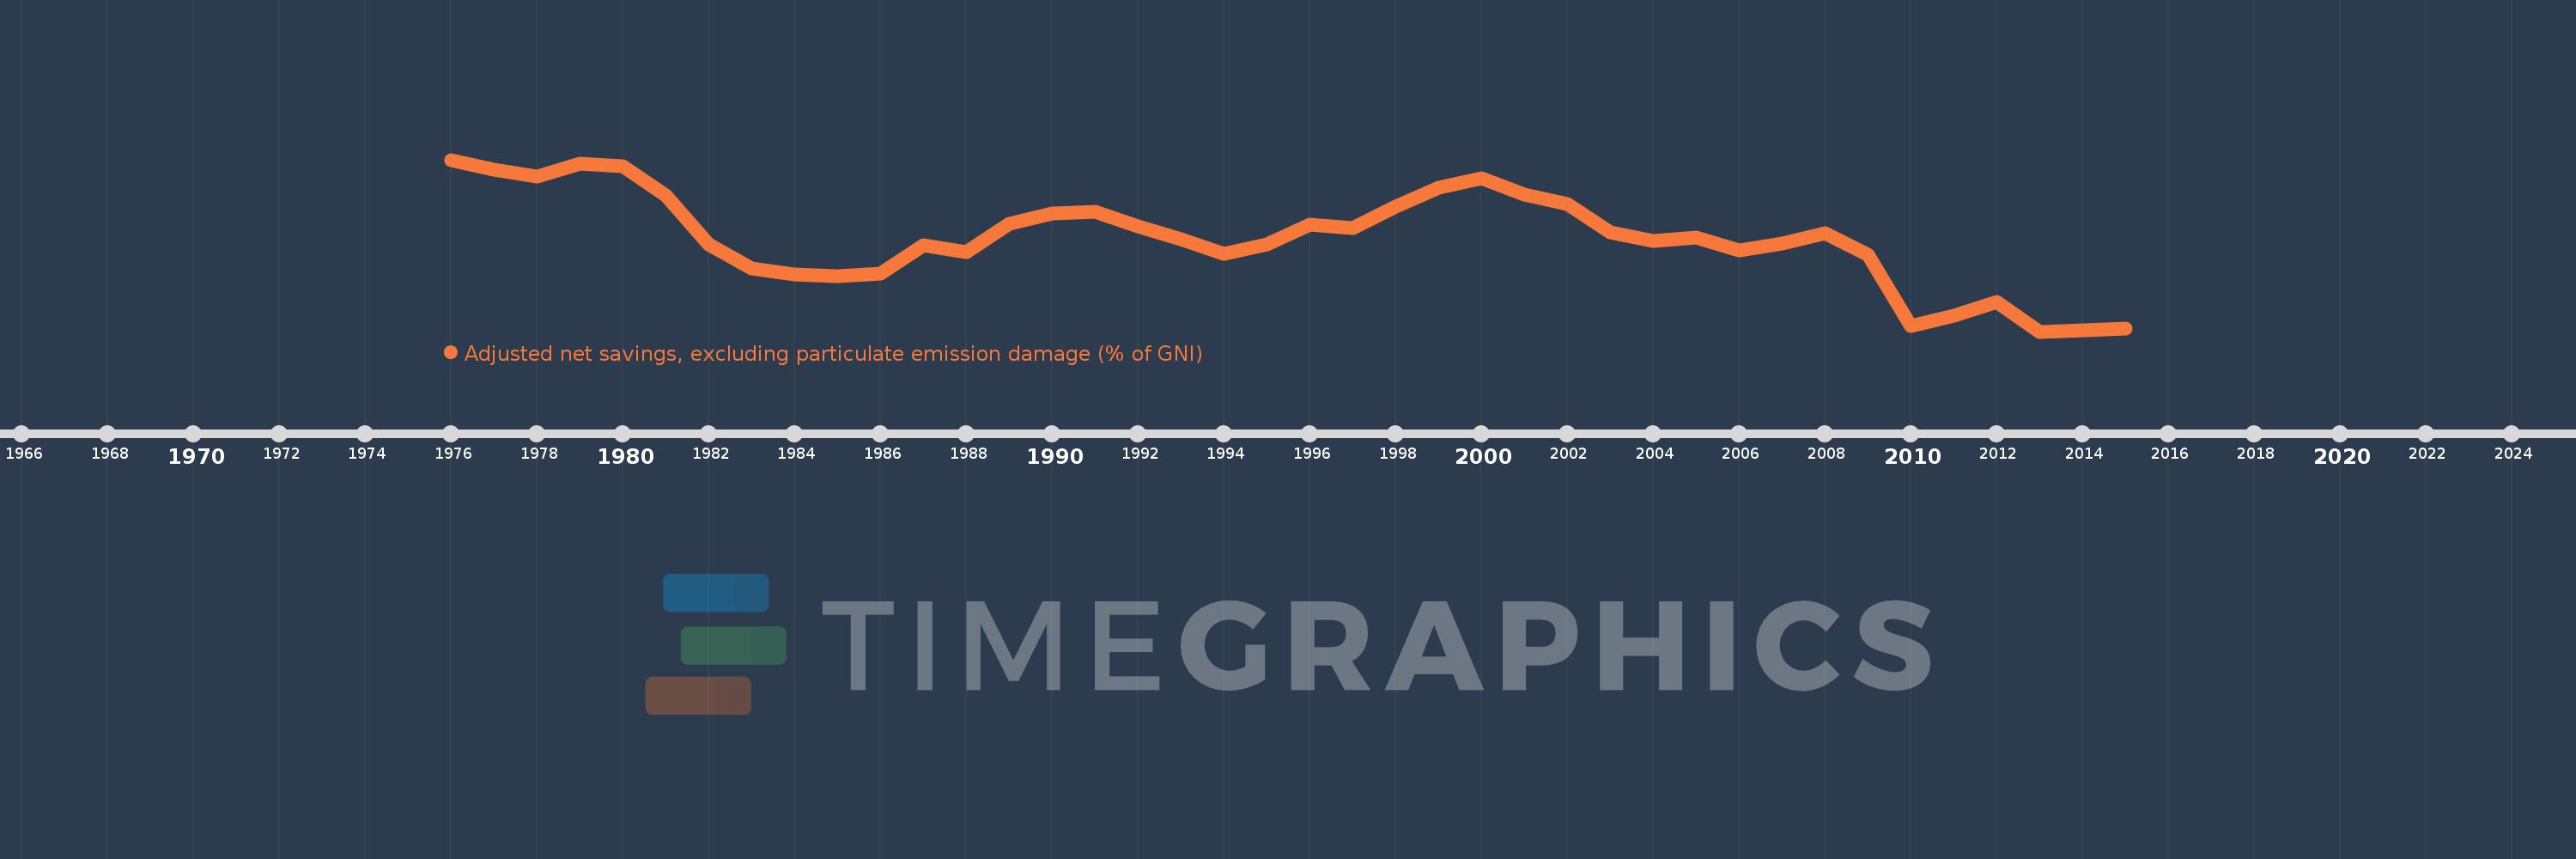
Adjusted net savings, excluding particulate emission damage (% of GNI)
2015,2014,2013,2012,2011,2010,2009,2008,2007,2006,2005,2004,2003,2002,2001,2000,1999,1998,1997,1996,1995,1994,1993,1992,1991,1990,1989,1988,1987,1986,1985,1984,1983,1982,1981,1980,1979,1978,1977,1976
Cette statistique dans les autres pays:
AfghanistanAlbaniaAlgeriaAngolaArab WorldArgentinaArmeniaAustraliaAustriaAzerbaijanBahamas, TheBahrainBangladeshBarbadosBelarusBelgiumBelizeBeninBhutanBoliviaBotswanaBrazilBrunei DarussalamBulgariaBurkina FasoBurundiCabo VerdeCambodiaCameroonCanadaCaribbean small statesCentral African RepublicCentral Europe and the BalticsChadChileChinaColombiaComorosCongo, Dem. Rep.Congo, Rep.Costa RicaCote d'IvoireCroatiaCyprusCzech RepublicDenmarkDjiboutiDominicaDominican RepublicEarly-demographic dividendEast Asia & PacificEast Asia & Pacific (excluding high income)East Asia & Pacific (IDA & IBRD countries)EcuadorEgypt, Arab Rep.El SalvadorEquatorial GuineaEritreaEstoniaEthiopiaEuro areaEurope & Central AsiaEurope & Central Asia (excluding high income)Europe & Central Asia (IDA & IBRD countries)European UnionFijiFinlandFragile and conflict affected situationsFranceGabonGambia, TheGeorgiaGermanyGhanaGreeceGuatemalaGuineaGuinea-BissauGuyanaHaitiHeavily indebted poor countries (HIPC)High incomeHondurasHungaryIBRD onlyIcelandIDA & IBRD totalIDA blendIDA onlyIDA totalIndiaIndonesiaIran, Islamic Rep.IraqIrelandIsraelItalyJamaicaJapanJordanKazakhstanKenyaKiribatiKorea, Rep.KuwaitKyrgyz RepublicLao PDRLate-demographic dividendLatin America & Caribbean Latin America & Caribbean (excluding high income)Latin America & the Caribbean (IDA & IBRD countries)LatviaLeast developed countries: UN classificationLebanonLesothoLiberiaLibyaLithuaniaLow & middle incomeLow incomeLower middle incomeLuxembourgMacedonia, FYRMadagascarMalawiMalaysiaMaldivesMaliMauritaniaMauritiusMexicoMiddle East & North AfricaMiddle East & North Africa (excluding high income)Middle East & North Africa (IDA & IBRD countries)Middle incomeMoldovaMongoliaMoroccoMozambiqueNamibiaNepalNetherlandsNew ZealandNicaraguaNigerNigeriaNorth AmericaNorwayOECD membersOmanOther small statesPacific island small statesPakistanPanamaPapua New GuineaParaguayPeruPhilippinesPolandPortugalPost-demographic dividendPre-demographic dividendQatarRomaniaRussian FederationRwandaSaudi ArabiaSenegalSeychellesSierra LeoneSingaporeSlovak RepublicSloveniaSmall statesSolomon IslandsSouth AfricaSouth AsiaSouth Asia (IDA & IBRD)SpainSri LankaSt. LuciaSt. Vincent and the GrenadinesSub-Saharan Africa Sub-Saharan Africa (excluding high income)Sub-Saharan Africa (IDA & IBRD countries)SudanSurinameSwazilandSwedenSwitzerlandSyrian Arab RepublicTajikistanTanzaniaThailandTogoTongaTrinidad and TobagoTunisiaTurkeyUgandaUkraineUnited KingdomUnited StatesUpper middle incomeUruguayVanuatuVenezuela, RBVietnamWorldYemen, Rep.ZambiaZimbabwe La ligne de temps
Cette échelle de temps montre un graphique de 1976 année à 2015 année France. Les données jusqu'à 1975 année ne sont pas présentés. Quantité d'observations actuelles selon dates: 40.
Source (désignation):
Les indicateurs du développement mondiale
Source (organisation):
World Bank staff estimates based on sources and methods in World Bank's "The Changing Wealth of Nations: Measuring Sustainable Development in the New Millennium" (2011).
Catégories:
Economy & Growth, Environment
Dernière mise à jour
23 avr. 2017
Les indicateurs de changement de valeurs selon les années
Minimum:
6.643
1 janv. 2013
Maximum:
14.729
1 janv. 1976
Pour la date d''observation
Valeur
Changement absolu
Le changement par rapport à la valeur précédente
1 janv. 1976
14.729
+14.729
0.0%
1 janv. 1977
14.279
-0.45
-3.05%
1 janv. 1978
13.953
-0.326
-2.28%
1 janv. 1979
14.533
+0.58
4.15%
1 janv. 1980
14.433
-0.1
-0.69%
1 janv. 1981
13.046
-1.387
-9.61%
1 janv. 1982
10.728
-2.318
-17.77%
1 janv. 1983
9.599
-1.128
-10.52%
1 janv. 1984
9.313
-0.286
-2.98%
1 janv. 1985
9.269
-0.044
-0.47%
1 janv. 1986
9.364
+0.095
1.03%
1 janv. 1987
10.72
+1.355
14.47%
1 janv. 1988
10.383
-0.337
-3.15%
1 janv. 1989
11.721
+1.338
12.89%
1 janv. 1990
12.194
+0.473
4.04%
1 janv. 1991
12.283
+0.089
0.73%
1 janv. 1992
11.579
-0.704
-5.73%
1 janv. 1993
10.998
-0.581
-5.02%
1 janv. 1994
10.298
-0.699
-6.36%
1 janv. 1995
10.759
+0.46
4.47%
1 janv. 1996
11.669
+0.91
8.46%
1 janv. 1997
11.497
-0.172
-1.48%
1 janv. 1998
12.507
+1.01
8.79%
1 janv. 1999
13.403
+0.896
7.16%
1 janv. 2000
13.87
+0.467
3.48%
1 janv. 2001
13.1
-0.77
-5.55%
1 janv. 2002
12.628
-0.473
-3.61%
1 janv. 2003
11.324
-1.304
-10.32%
1 janv. 2004
10.892
-0.432
-3.81%
1 janv. 2005
11.064
+0.172
1.58%
1 janv. 2006
10.452
-0.612
-5.53%
1 janv. 2007
10.806
+0.355
3.39%
1 janv. 2008
11.272
+0.466
4.31%
1 janv. 2009
10.245
-1.027
-9.11%
1 janv. 2010
6.905
-3.34
-32.6%
1 janv. 2011
7.375
+0.47
6.81%
1 janv. 2012
8.046
+0.671
9.09%
1 janv. 2013
6.643
-1.403
-17.44%
1 janv. 2014
6.707
+0.064
0.96%
1 janv. 2015
6.778
+0.071
1.07%
Classement des pays selon les statistiques actuelles par années


Commentaires: