29
/fr/
fr
AIzaSyAYiBZKx7MnpbEhh9jyipgxe19OcubqV5w
April 1, 2024
39318
IDA only
IDX
false
2
1
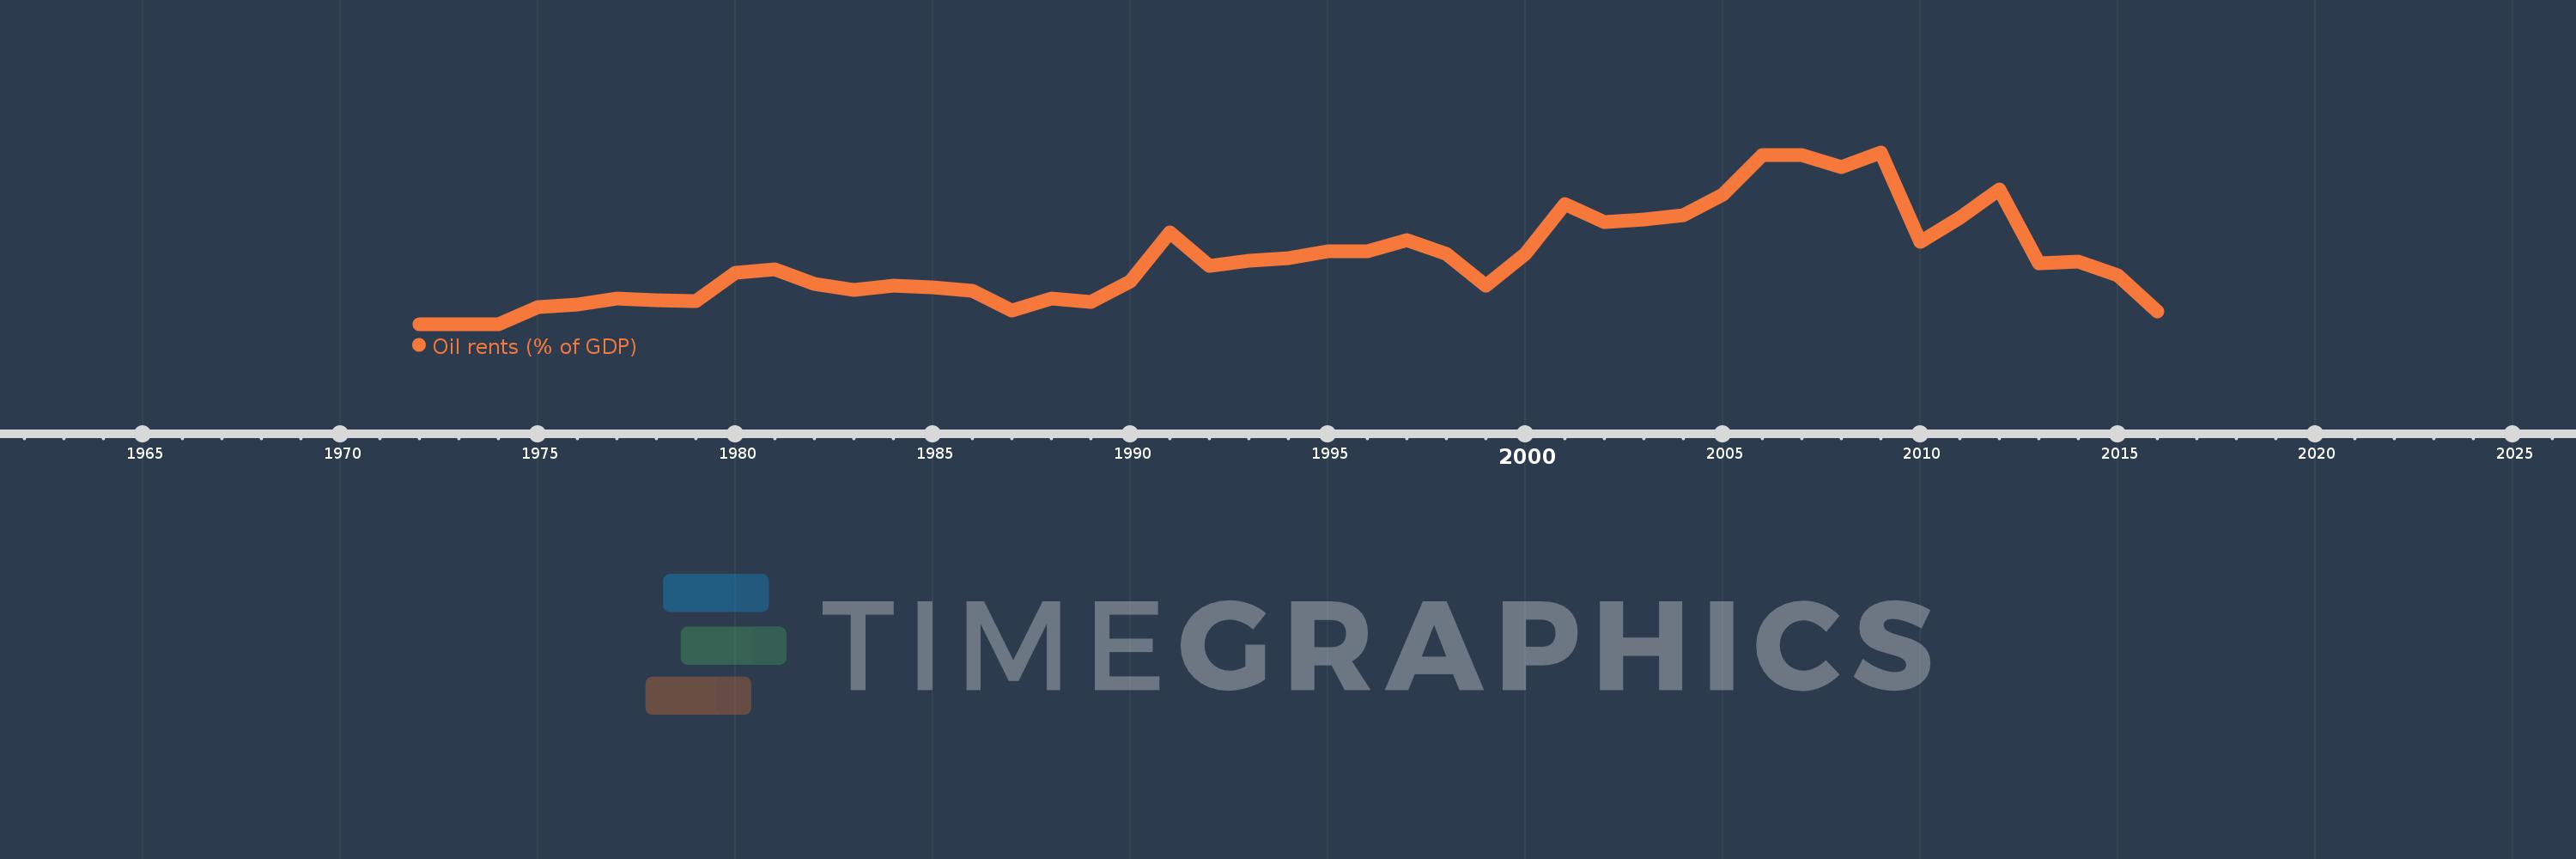
Oil rents (% of GDP)
2016,2015,2014,2013,2012,2011,2010,2009,2008,2007,2006,2005,2004,2003,2002,2001,2000,1999,1998,1997,1996,1995,1994,1993,1992,1991,1990,1989,1988,1987,1986,1985,1984,1983,1982,1981,1980,1979,1978,1977,1976,1975,1974,1973,1972
Cette statistique dans les autres pays:
La ligne de temps
Cette échelle de temps montre un graphique de 1972 année à 2016 année IDA only. Les données jusqu'à 1971 année ne sont pas présentés. Quantité d'observations actuelles selon dates: 45.
Source (désignation):
Les indicateurs du développement mondiale
Source (organisation):
Estimates based on sources and methods described in "The Changing Wealth of Nations: Measuring Sustainable Development in the New Millennium" (World Bank, 2011).
Catégories:
Energy & Mining, Environment
Dernière mise à jour
23 avr. 2017
Les indicateurs de changement de valeurs selon les années
Minimum:
0.001
1 janv. 1972
Maximum:
6.951
1 janv. 2009
Pour la date d''observation
Valeur
Changement absolu
Le changement par rapport à la valeur précédente
1 janv. 1972
0.001
+0.001
0.0%
1 janv. 1973
0.002
+0.001
117.29%
1 janv. 1974
0.005
+0.003
173.13%
1 janv. 1975
0.704
+0.699
14.12 milles%
1 janv. 1976
0.808
+0.104
14.81%
1 janv. 1977
1.044
+0.236
29.17%
1 janv. 1978
0.98
-0.065
-6.19%
1 janv. 1979
0.946
-0.033
-3.39%
1 janv. 1980
2.094
+1.147
121.23%
1 janv. 1981
2.207
+0.113
5.42%
1 janv. 1982
1.642
-0.565
-25.62%
1 janv. 1983
1.376
-0.266
-16.18%
1 janv. 1984
1.553
+0.177
12.83%
1 janv. 1985
1.476
-0.077
-4.94%
1 janv. 1986
1.367
-0.109
-7.41%
1 janv. 1987
0.556
-0.811
-59.32%
1 janv. 1988
1.028
+0.472
84.94%
1 janv. 1989
0.916
-0.112
-10.86%
1 janv. 1990
1.741
+0.824
89.94%
1 janv. 1991
3.731
+1.99
114.31%
1 janv. 1992
2.347
-1.384
-37.08%
1 janv. 1993
2.584
+0.237
10.08%
1 janv. 1994
2.663
+0.079
3.05%
1 janv. 1995
2.949
+0.286
10.73%
1 janv. 1996
2.941
-0.007
-0.24%
1 janv. 1997
3.404
+0.462
15.72%
1 janv. 1998
2.859
-0.545
-16.01%
1 janv. 1999
1.565
-1.294
-45.25%
1 janv. 2000
2.843
+1.278
81.62%
1 janv. 2001
4.853
+2.011
70.73%
1 janv. 2002
4.118
-0.735
-15.15%
1 janv. 2003
4.25
+0.132
3.21%
1 janv. 2004
4.427
+0.176
4.15%
1 janv. 2005
5.232
+0.806
18.2%
1 janv. 2006
6.847
+1.615
30.86%
1 janv. 2007
6.829
-0.018
-0.27%
1 janv. 2008
6.361
-0.468
-6.85%
1 janv. 2009
6.951
+0.59
9.27%
1 janv. 2010
3.32
-3.631
-52.24%
1 janv. 2011
4.296
+0.976
29.41%
1 janv. 2012
5.444
+1.148
26.73%
1 janv. 2013
2.463
-2.981
-54.76%
1 janv. 2014
2.52
+0.057
2.31%
1 janv. 2015
1.984
-0.535
-21.24%
1 janv. 2016
0.515
-1.469
-74.04%
Classement des pays selon les statistiques actuelles par années


Commentaires: