29
/fr/
fr
AIzaSyAYiBZKx7MnpbEhh9jyipgxe19OcubqV5w
April 1, 2024
269784
Turkey
TUR
true
2
1
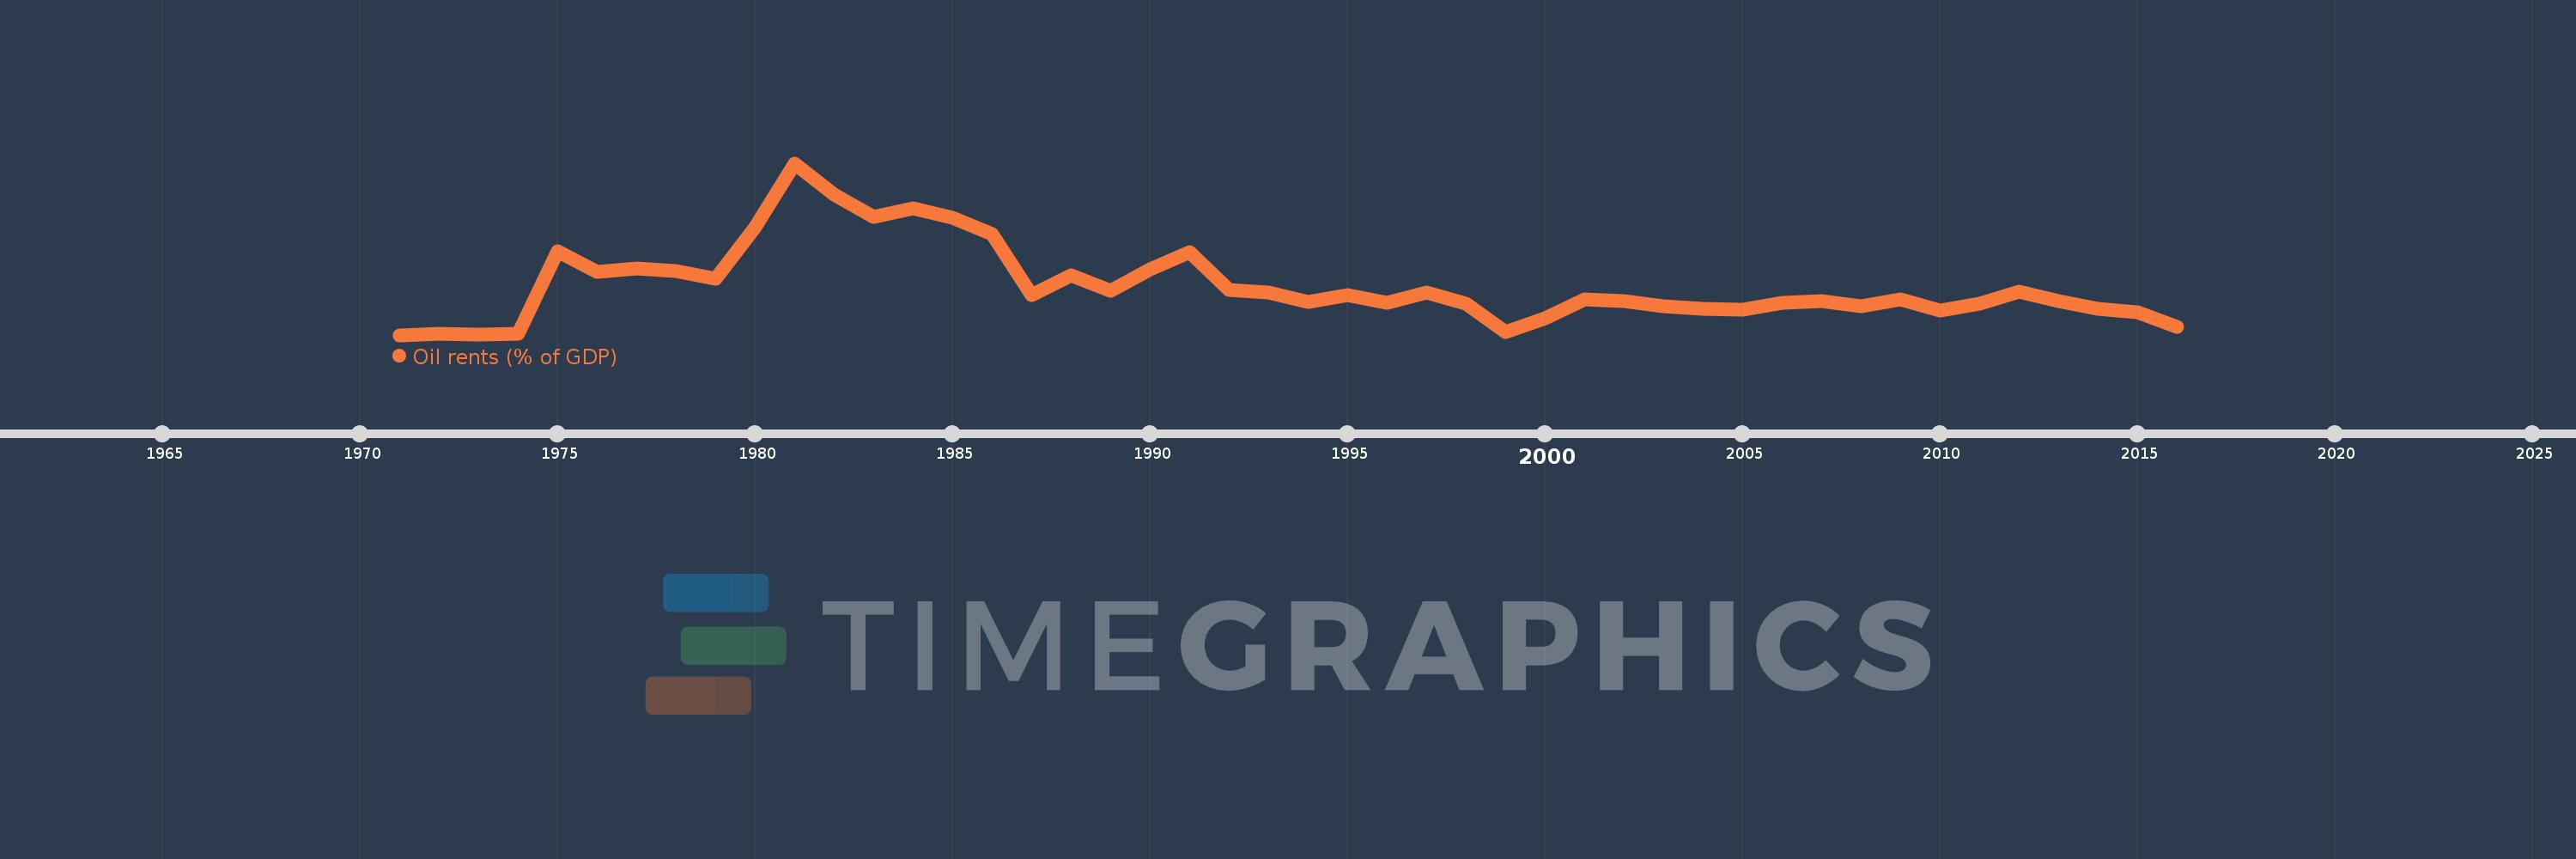
Oil rents (% of GDP)
2016,2015,2014,2013,2012,2011,2010,2009,2008,2007,2006,2005,2004,2003,2002,2001,2000,1999,1998,1997,1996,1995,1994,1993,1992,1991,1990,1989,1988,1987,1986,1985,1984,1983,1982,1981,1980,1979,1978,1977,1976,1975,1974,1973,1972,1971
Cette statistique dans les autres pays:
La ligne de temps
Cette échelle de temps montre un graphique de 1971 année à 2016 année Turkey. Les données jusqu'à 1970 année ne sont pas présentés. Quantité d'observations actuelles selon dates: 46.
Source (désignation):
Les indicateurs du développement mondiale
Source (organisation):
Estimates based on sources and methods described in "The Changing Wealth of Nations: Measuring Sustainable Development in the New Millennium" (World Bank, 2011).
Catégories:
Energy & Mining, Environment
Dernière mise à jour
23 avr. 2017
Les indicateurs de changement de valeurs selon les années
Minimum:
0.004
1 janv. 1971
Maximum:
0.514
1 janv. 1981
Pour la date d''observation
Valeur
Changement absolu
Le changement par rapport à la valeur précédente
1 janv. 1971
0.004
+0.004
0.0%
1 janv. 1972
0.007
+0.003
81.26%
1 janv. 1973
0.006
0.0
-7.38%
1 janv. 1974
0.008
+0.002
27.3%
1 janv. 1975
0.253
+0.245
3.19 milles%
1 janv. 1976
0.192
-0.06
-23.91%
1 janv. 1977
0.202
+0.01
5.14%
1 janv. 1978
0.193
-0.009
-4.55%
1 janv. 1979
0.172
-0.021
-10.88%
1 janv. 1980
0.324
+0.152
88.13%
1 janv. 1981
0.514
+0.19
58.73%
1 janv. 1982
0.422
-0.092
-17.98%
1 janv. 1983
0.355
-0.066
-15.69%
1 janv. 1984
0.38
+0.025
6.89%
1 janv. 1985
0.351
-0.029
-7.68%
1 janv. 1986
0.304
-0.047
-13.42%
1 janv. 1987
0.123
-0.181
-59.49%
1 janv. 1988
0.181
+0.058
47.18%
1 janv. 1989
0.136
-0.045
-25.03%
1 janv. 1990
0.198
+0.062
45.76%
1 janv. 1991
0.249
+0.051
26.01%
1 janv. 1992
0.138
-0.112
-44.83%
1 janv. 1993
0.131
-0.007
-4.76%
1 janv. 1994
0.102
-0.029
-22.3%
1 janv. 1995
0.123
+0.021
20.43%
1 janv. 1996
0.1
-0.022
-18.08%
1 janv. 1997
0.129
+0.029
28.86%
1 janv. 1998
0.097
-0.033
-25.42%
1 janv. 1999
0.013
-0.083
-86.07%
1 janv. 2000
0.055
+0.042
312.28%
1 janv. 2001
0.111
+0.056
100.78%
1 janv. 2002
0.105
-0.006
-5.56%
1 janv. 2003
0.09
-0.015
-14.26%
1 janv. 2004
0.081
-0.009
-10.22%
1 janv. 2005
0.08
-0.001
-1.62%
1 janv. 2006
0.1
+0.02
25.21%
1 janv. 2007
0.105
+0.005
5.18%
1 janv. 2008
0.089
-0.016
-14.9%
1 janv. 2009
0.11
+0.021
23.51%
1 janv. 2010
0.076
-0.035
-31.38%
1 janv. 2011
0.097
+0.021
28.26%
1 janv. 2012
0.132
+0.035
36.21%
1 janv. 2013
0.105
-0.028
-20.87%
1 janv. 2014
0.083
-0.021
-20.31%
1 janv. 2015
0.072
-0.012
-13.9%
1 janv. 2016
0.029
-0.043
-59.96%
Classement des pays selon les statistiques actuelles par années


Commentaires: