29
/fr/
fr
AIzaSyAYiBZKx7MnpbEhh9jyipgxe19OcubqV5w
April 1, 2024
222638
Peru
PER
true
2
1
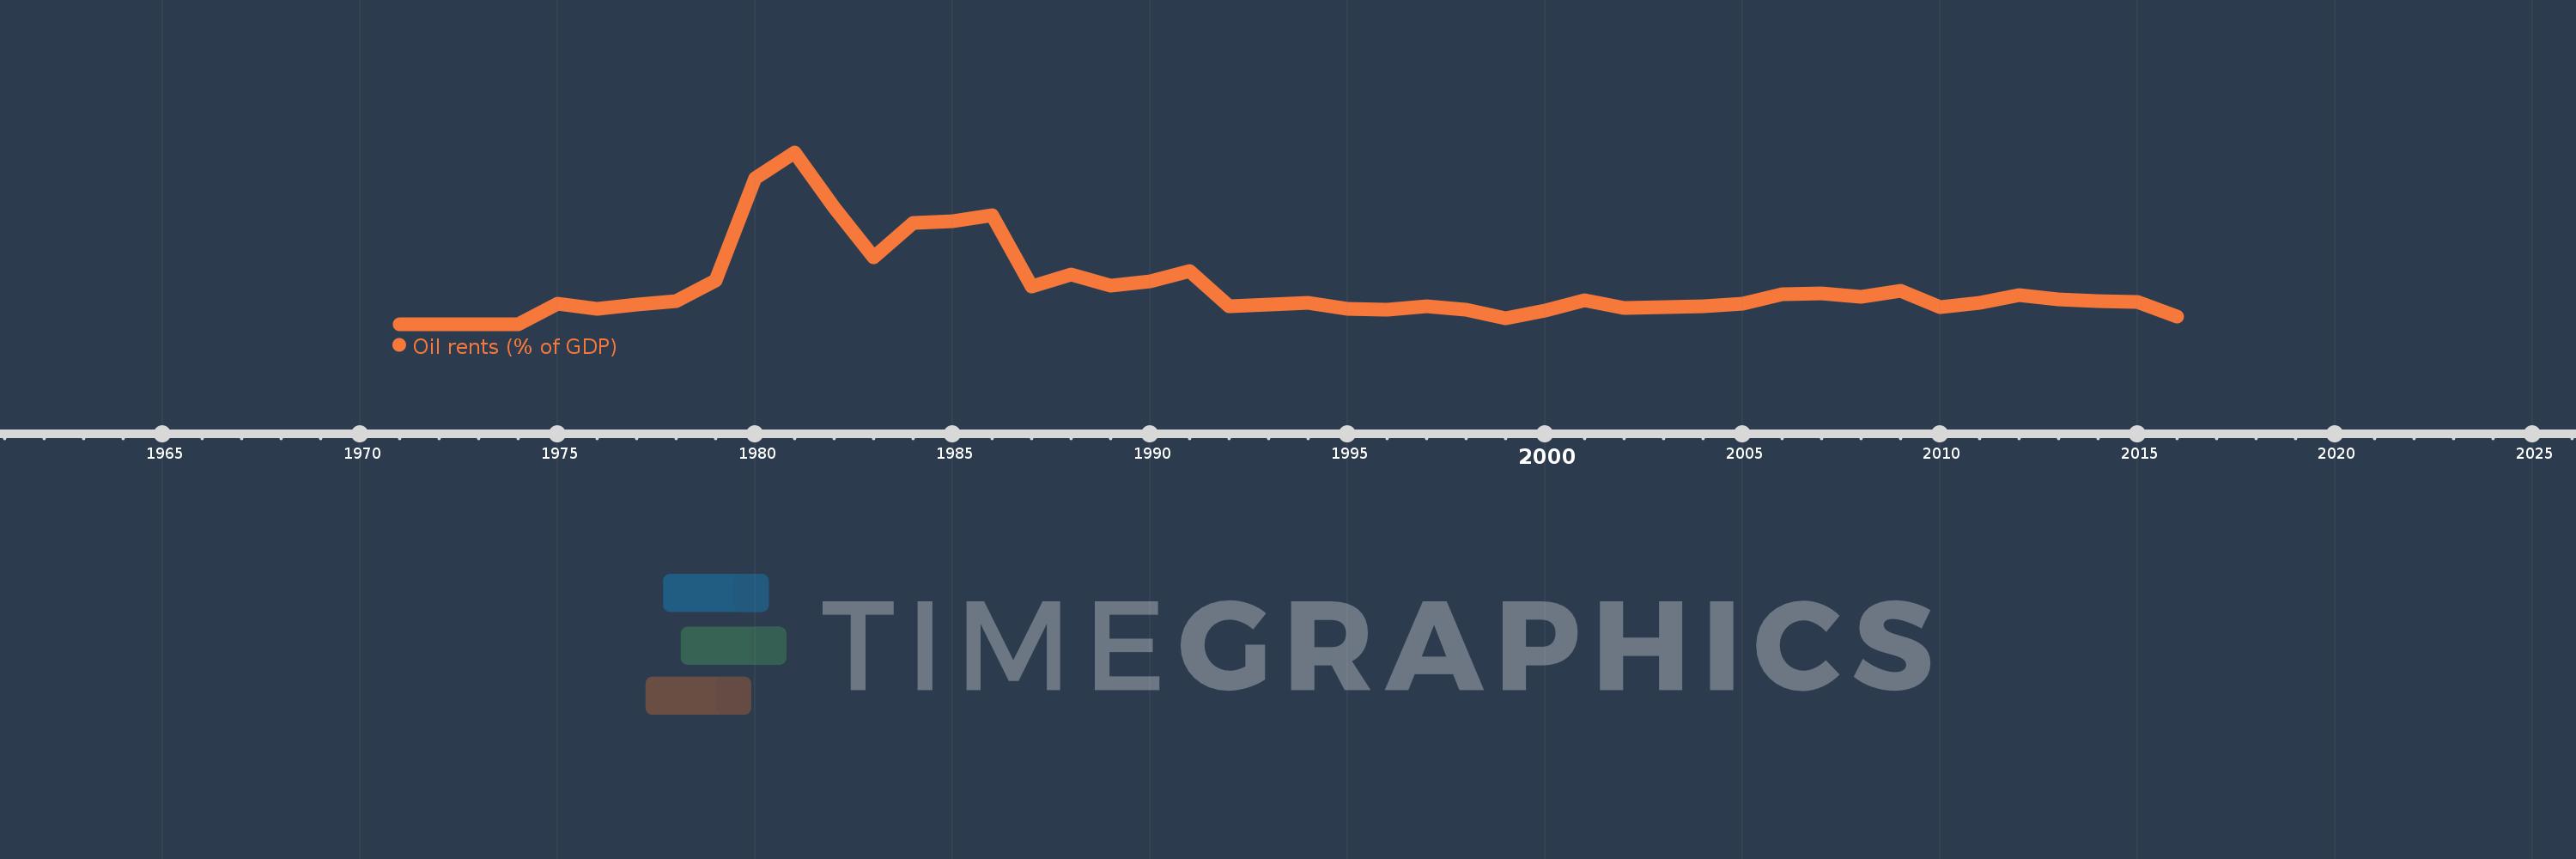
Oil rents (% of GDP)
2016,2015,2014,2013,2012,2011,2010,2009,2008,2007,2006,2005,2004,2003,2002,2001,2000,1999,1998,1997,1996,1995,1994,1993,1992,1991,1990,1989,1988,1987,1986,1985,1984,1983,1982,1981,1980,1979,1978,1977,1976,1975,1974,1973,1972,1971
Cette statistique dans les autres pays:
La ligne de temps
Cette échelle de temps montre un graphique de 1971 année à 2016 année Peru. Les données jusqu'à 1970 année ne sont pas présentés. Quantité d'observations actuelles selon dates: 46.
Source (désignation):
Les indicateurs du développement mondiale
Source (organisation):
Estimates based on sources and methods described in "The Changing Wealth of Nations: Measuring Sustainable Development in the New Millennium" (World Bank, 2011).
Catégories:
Energy & Mining, Environment
Dernière mise à jour
23 avr. 2017
Les indicateurs de changement de valeurs selon les années
Maximum:
8.917
1 janv. 1981
Pour la date d''observation
Valeur
Changement absolu
Le changement par rapport à la valeur précédente
1 janv. 1971
0.0
+0.0
0.0%
1 janv. 1972
0.0
+0.0
235.0%
1 janv. 1973
0.0
+0.0
3.8%
1 janv. 1974
0.003
+0.003
759.31%
1 janv. 1975
1.064
+1.061
31.34 milles%
1 janv. 1976
0.791
-0.273
-25.67%
1 janv. 1977
1.027
+0.236
29.84%
1 janv. 1978
1.179
+0.151
14.74%
1 janv. 1979
2.248
+1.07
90.78%
1 janv. 1980
7.581
+5.333
237.19%
1 janv. 1981
8.917
+1.336
17.62%
1 janv. 1982
6.045
-2.872
-32.21%
1 janv. 1983
3.462
-2.583
-42.72%
1 janv. 1984
5.273
+1.811
52.31%
1 janv. 1985
5.338
+0.065
1.24%
1 janv. 1986
5.657
+0.318
5.96%
1 janv. 1987
1.97
-3.687
-65.17%
1 janv. 1988
2.566
+0.597
30.28%
1 janv. 1989
2.02
-0.546
-21.28%
1 janv. 1990
2.207
+0.187
9.24%
1 janv. 1991
2.757
+0.55
24.94%
1 janv. 1992
0.95
-1.807
-65.54%
1 janv. 1993
1.027
+0.077
8.12%
1 janv. 1994
1.103
+0.076
7.38%
1 janv. 1995
0.798
-0.306
-27.69%
1 janv. 1996
0.735
-0.063
-7.88%
1 janv. 1997
0.943
+0.208
28.26%
1 janv. 1998
0.746
-0.196
-20.83%
1 janv. 1999
0.321
-0.425
-57.01%
1 janv. 2000
0.695
+0.374
116.54%
1 janv. 2001
1.24
+0.546
78.55%
1 janv. 2002
0.841
-0.399
-32.17%
1 janv. 2003
0.868
+0.026
3.13%
1 janv. 2004
0.917
+0.049
5.68%
1 janv. 2005
1.059
+0.142
15.49%
1 janv. 2006
1.534
+0.475
44.88%
1 janv. 2007
1.622
+0.087
5.68%
1 janv. 2008
1.424
-0.198
-12.19%
1 janv. 2009
1.716
+0.293
20.55%
1 janv. 2010
0.87
-0.847
-49.32%
1 janv. 2011
1.132
+0.262
30.09%
1 janv. 2012
1.494
+0.363
32.05%
1 janv. 2013
1.286
-0.209
-13.96%
1 janv. 2014
1.179
-0.107
-8.33%
1 janv. 2015
1.165
-0.014
-1.15%
1 janv. 2016
0.377
-0.788
-67.62%
Classement des pays selon les statistiques actuelles par années


Commentaires: