29
/fr/
fr
AIzaSyAYiBZKx7MnpbEhh9jyipgxe19OcubqV5w
April 1, 2024
258737
Syrian Arab Republic
SYR
true
2
1
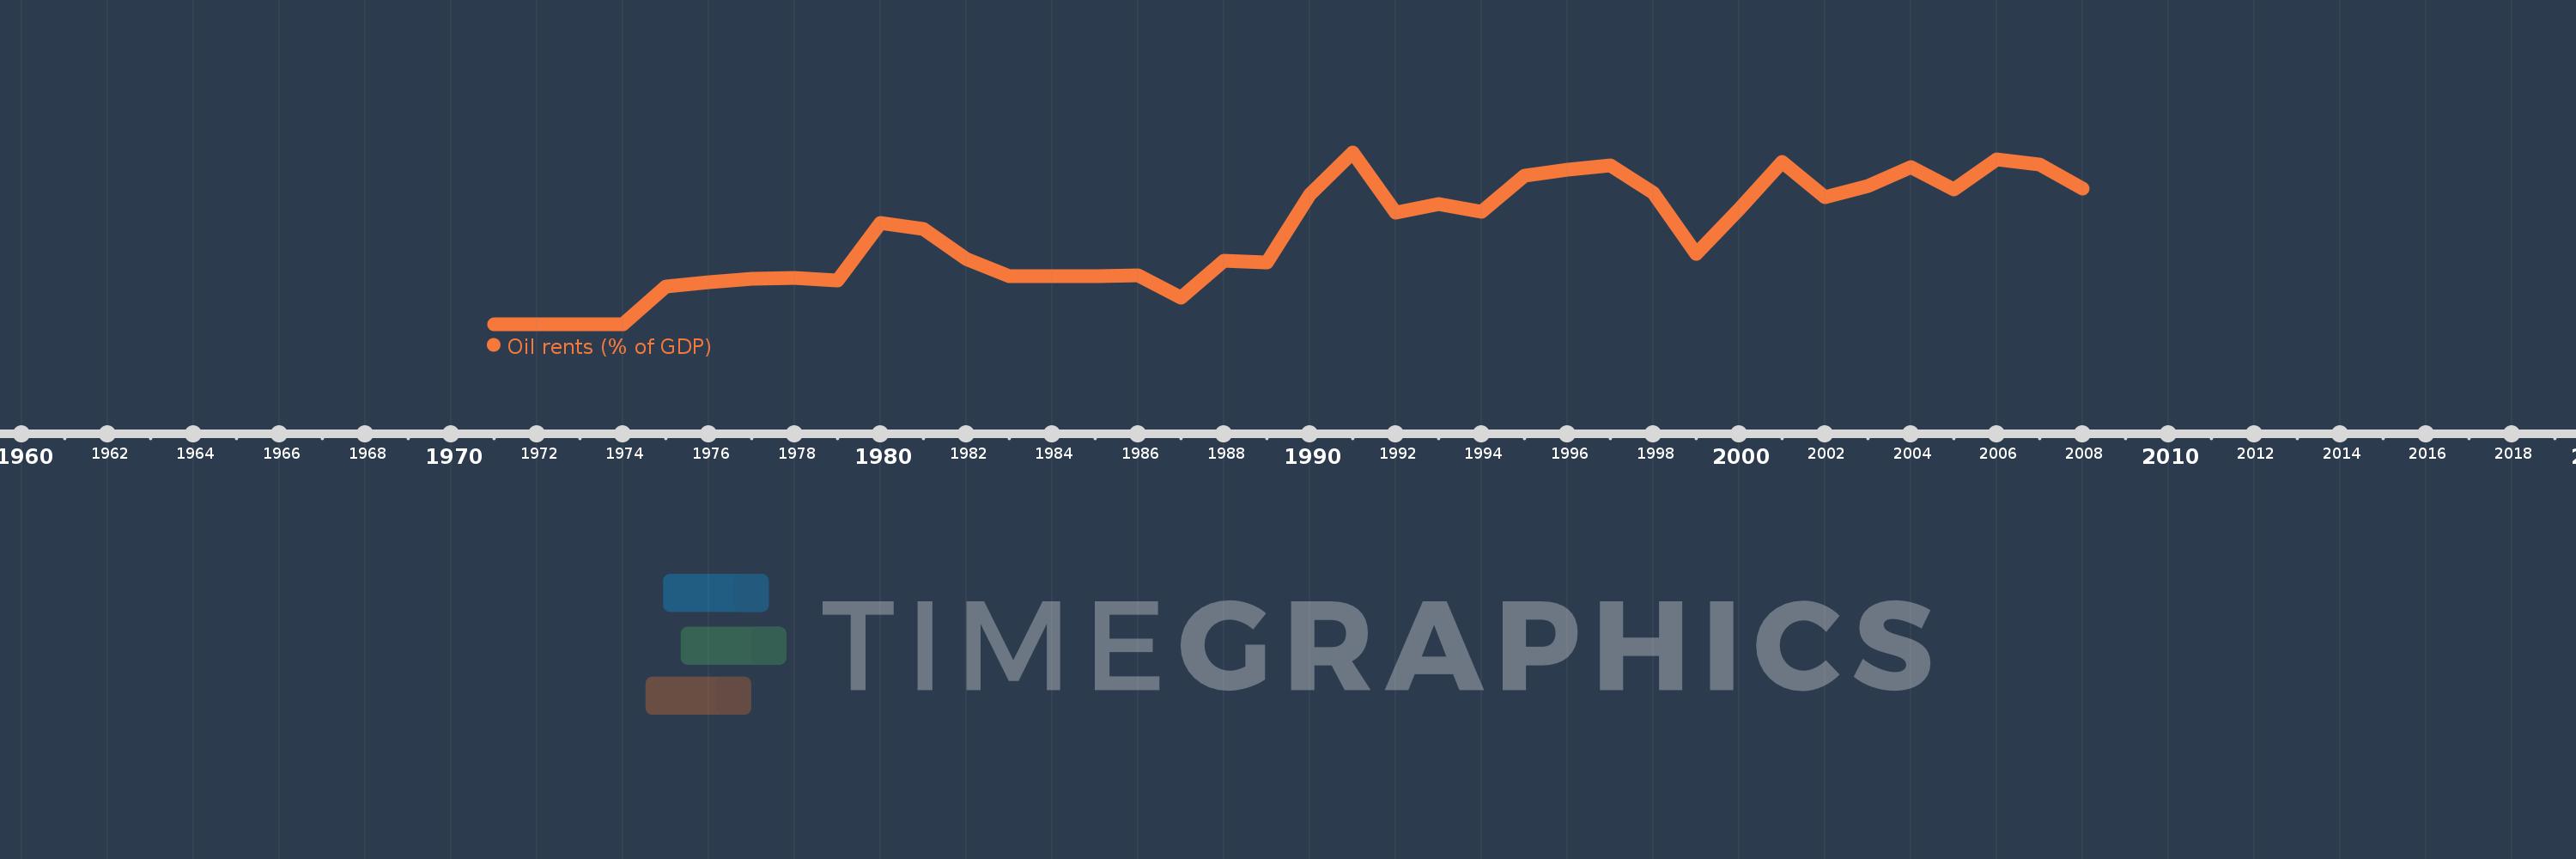
Oil rents (% of GDP)
2008,2007,2006,2005,2004,2003,2002,2001,2000,1999,1998,1997,1996,1995,1994,1993,1992,1991,1990,1989,1988,1987,1986,1985,1984,1983,1982,1981,1980,1979,1978,1977,1976,1975,1974,1973,1972,1971
Cette statistique dans les autres pays:
La ligne de temps
Cette échelle de temps montre un graphique de 1971 année à 2008 année Syrian Arab Republic. Les données jusqu'à 1970 année ne sont pas présentés. Quantité d'observations actuelles selon dates: 38.
Source (désignation):
Les indicateurs du développement mondiale
Source (organisation):
Estimates based on sources and methods described in "The Changing Wealth of Nations: Measuring Sustainable Development in the New Millennium" (World Bank, 2011).
Catégories:
Energy & Mining, Environment
Dernière mise à jour
23 avr. 2017
Les indicateurs de changement de valeurs selon les années
Minimum:
0.008
1 janv. 1972
Maximum:
25.445
1 janv. 1991
Pour la date d''observation
Valeur
Changement absolu
Le changement par rapport à la valeur précédente
1 janv. 1971
0.008
+0.008
0.0%
1 janv. 1972
0.008
0.0
-2.08%
1 janv. 1973
0.015
+0.007
79.32%
1 janv. 1974
0.046
+0.031
210.05%
1 janv. 1975
5.579
+5.533
12.07 milles%
1 janv. 1976
6.191
+0.612
10.97%
1 janv. 1977
6.719
+0.528
8.53%
1 janv. 1978
6.926
+0.208
3.09%
1 janv. 1979
6.436
-0.49
-7.08%
1 janv. 1980
15.056
+8.62
133.94%
1 janv. 1981
14.111
-0.946
-6.28%
1 janv. 1982
9.633
-4.477
-31.73%
1 janv. 1983
7.059
-2.574
-26.72%
1 janv. 1984
7.125
+0.066
0.93%
1 janv. 1985
7.058
-0.067
-0.94%
1 janv. 1986
7.235
+0.177
2.5%
1 janv. 1987
3.913
-3.322
-45.92%
1 janv. 1988
9.37
+5.458
139.49%
1 janv. 1989
9.121
-0.249
-2.66%
1 janv. 1990
19.223
+10.101
110.75%
1 janv. 1991
25.445
+6.222
32.37%
1 janv. 1992
16.508
-8.937
-35.12%
1 janv. 1993
17.855
+1.347
8.16%
1 janv. 1994
16.697
-1.158
-6.49%
1 janv. 1995
21.937
+5.24
31.38%
1 janv. 1996
22.906
+0.97
4.42%
1 janv. 1997
23.464
+0.558
2.43%
1 janv. 1998
19.394
-4.07
-17.35%
1 janv. 1999
10.463
-8.931
-46.05%
1 janv. 2000
17.07
+6.606
63.14%
1 janv. 2001
24.066
+6.997
40.99%
1 janv. 2002
18.817
-5.249
-21.81%
1 janv. 2003
20.426
+1.609
8.55%
1 janv. 2004
23.232
+2.806
13.74%
1 janv. 2005
20.026
-3.207
-13.8%
1 janv. 2006
24.356
+4.33
21.62%
1 janv. 2007
23.66
-0.696
-2.86%
1 janv. 2008
20.066
-3.594
-15.19%
Classement des pays selon les statistiques actuelles par années


Commentaires: