29
/fr/
fr
AIzaSyAYiBZKx7MnpbEhh9jyipgxe19OcubqV5w
April 1, 2024
254481
Suriname
SUR
true
2
1
Oil rents (% of GDP)
2016,2015,2014,2013,2012,2011,2010,2009,2008,2007,2006,2005,2004,2003,2002,2001,2000,1999,1998,1997,1996,1995,1994,1993,1992,1991,1990,1989,1988,1987,1986,1985,1984,1983
Download
Bibliothèque de statistiques globales →Suriname →

Oil rents (% of GDP)

Cette statistique dans les autres pays:
AfghanistanAlbaniaAlgeriaAngolaArab WorldArgentinaArmeniaAustraliaAustriaAzerbaijanBahrainBangladeshBarbadosBelarusBelgiumBelizeBeninBoliviaBosnia and HerzegovinaBotswanaBrazilBrunei DarussalamBulgariaCambodiaCameroonCanadaCaribbean small statesCentral Europe and the BalticsChadChileChinaColombiaCongo, Dem. Rep.Congo, Rep.Costa RicaCote d'IvoireCroatiaCubaCyprusCzech RepublicDenmarkDominican RepublicEarly-demographic dividendEast Asia & PacificEast Asia & Pacific (excluding high income)East Asia & Pacific (IDA & IBRD countries)EcuadorEgypt, Arab Rep.El SalvadorEquatorial GuineaEritreaEstoniaEthiopiaEuro areaEurope & Central AsiaEurope & Central Asia (excluding high income)Europe & Central Asia (IDA & IBRD countries)European UnionFinlandFragile and conflict affected situationsFranceGabonGeorgiaGermanyGhanaGreeceGuatemalaHaitiHeavily indebted poor countries (HIPC)High incomeHondurasHungaryIBRD onlyIcelandIDA & IBRD totalIDA blendIDA onlyIDA totalIndiaIndonesiaIran, Islamic Rep.IraqIrelandIsraelItalyJamaicaJapanJordanKazakhstanKenyaKorea, Rep.KosovoKuwaitKyrgyz RepublicLate-demographic dividendLatin America & Caribbean Latin America & Caribbean (excluding high income)Latin America & the Caribbean (IDA & IBRD countries)LatviaLeast developed countries: UN classificationLebanonLibyaLithuaniaLow & middle incomeLower middle incomeLuxembourgMacedonia, FYRMalaysiaMaltaMauritaniaMauritiusMexicoMiddle East & North AfricaMiddle East & North Africa (excluding high income)Middle East & North Africa (IDA & IBRD countries)Middle incomeMongoliaMontenegroMoroccoMozambiqueMyanmarNamibiaNepalNetherlandsNew ZealandNicaraguaNigerNigeriaNorth AmericaNorwayOECD membersOmanOther small statesPakistanPanamaPapua New GuineaParaguayPeruPhilippinesPolandPortugalPost-demographic dividendPre-demographic dividendQatarRomaniaRussian FederationSaudi ArabiaSenegalSerbiaSingaporeSlovak RepublicSloveniaSmall statesSouth AfricaSouth AsiaSouth Asia (IDA & IBRD)South SudanSpainSri LankaSub-Saharan Africa Sub-Saharan Africa (excluding high income)Sub-Saharan Africa (IDA & IBRD countries)SudanSurinameSwedenSwitzerlandSyrian Arab RepublicTajikistanThailandTimor-LesteTogoTrinidad and TobagoTunisiaTurkeyTurkmenistanUkraineUnited Arab EmiratesUnited KingdomUnited StatesUpper middle incomeUruguayUzbekistanVenezuela, RBVietnamWest Bank and GazaWorldYemen, Rep.ZambiaZimbabwe
La ligne de temps
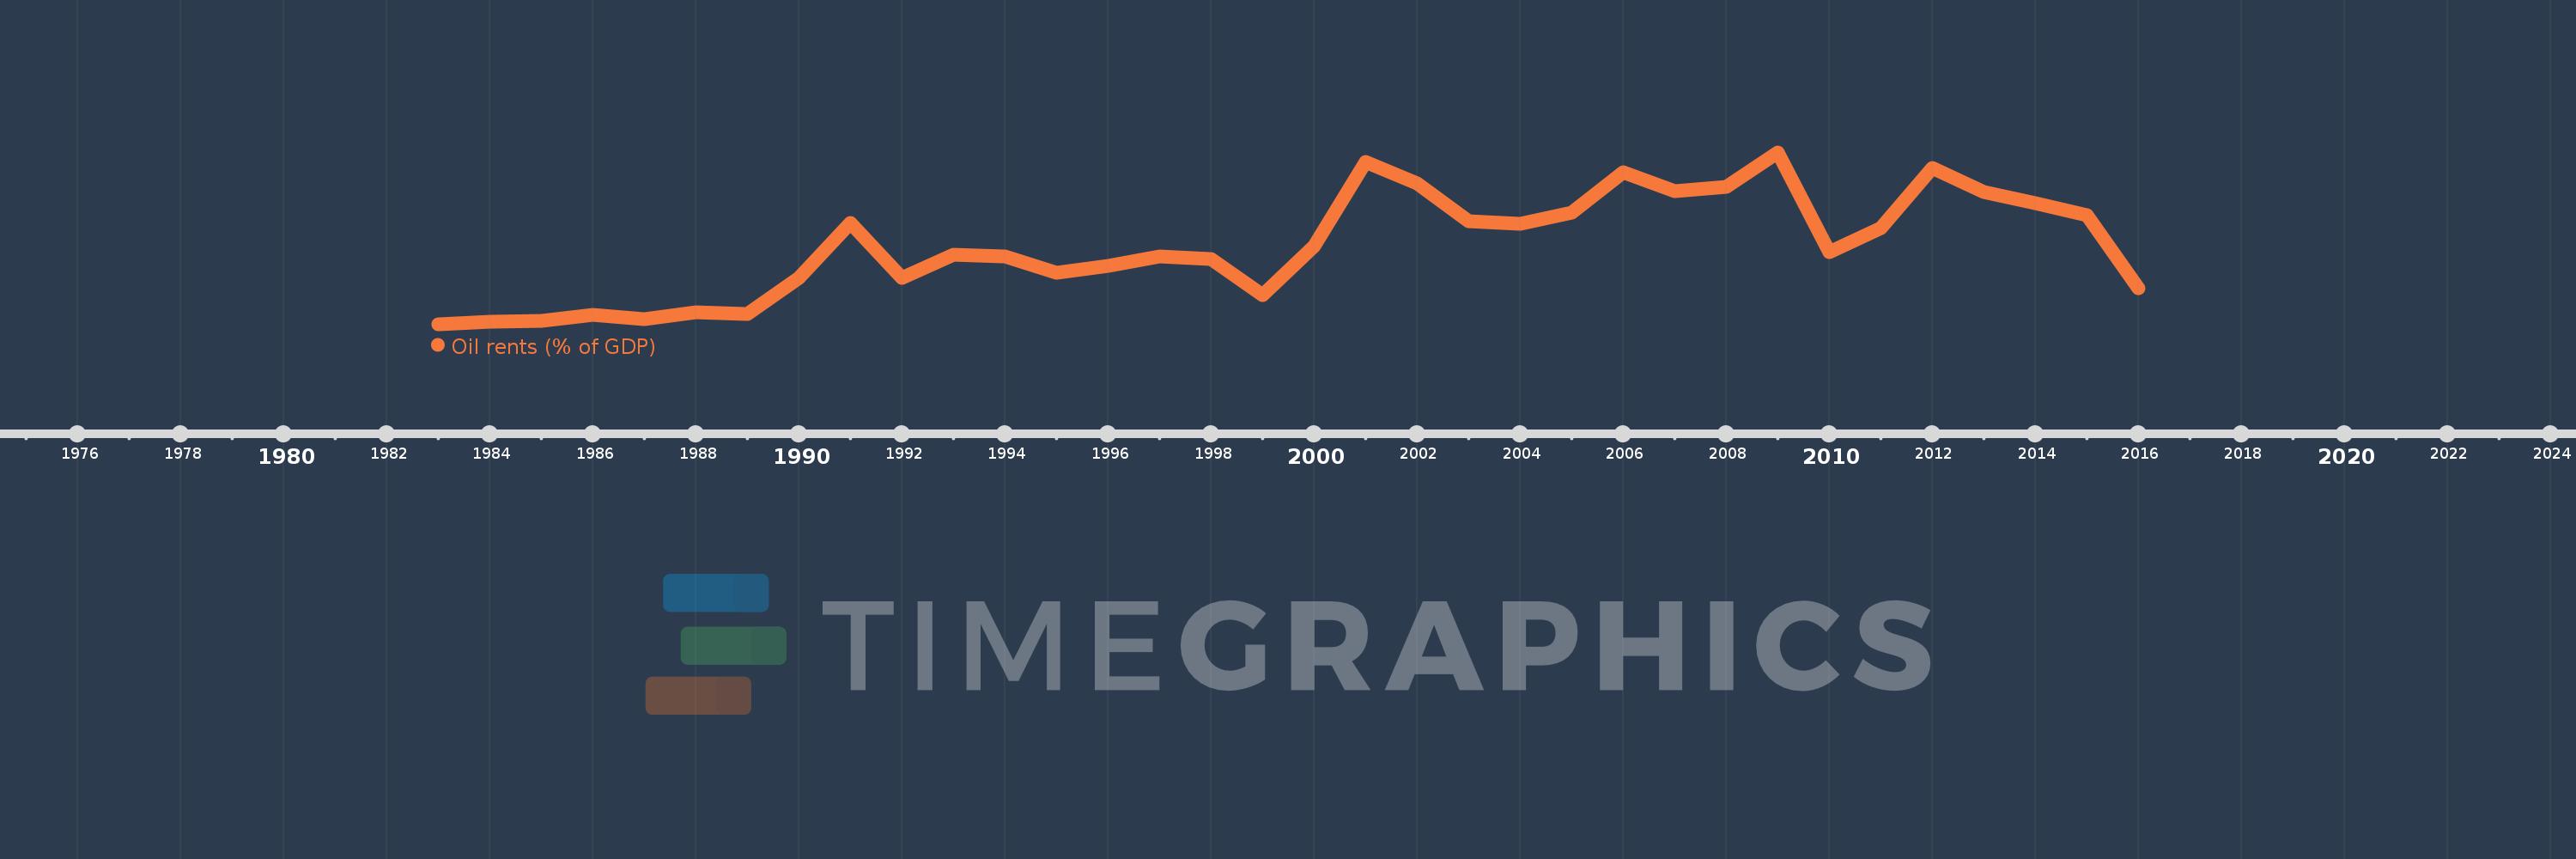
Cette échelle de temps montre un graphique de 1983 année à 2016 année Suriname. Les données jusqu'à 1982 année ne sont pas présentés. Quantité d'observations actuelles selon dates: 34.
Source (désignation):
Les indicateurs du développement mondiale
Source (organisation):
Estimates based on sources and methods described in "The Changing Wealth of Nations: Measuring Sustainable Development in the New Millennium" (World Bank, 2011).
Catégories:
Energy & Mining, Environment
Dernière mise à jour
23 avr. 2017
Les indicateurs de changement de valeurs selon les années
En moyenne:
4.403
Minimum:
0.065
1 janv. 1983
Maximum:
9.593
1 janv. 2009
Pour la date d''observation
Valeur
Changement absolu
Le changement par rapport à la valeur précédente
1 janv. 1983
0.065
+0.065
0.0%
1 janv. 1984
0.188
+0.123
187.81%
1 janv. 1985
0.274
+0.086
45.62%
1 janv. 1986
0.59
+0.315
114.93%
1 janv. 1987
0.365
-0.225
-38.14%
1 janv. 1988
0.715
+0.35
95.97%
1 janv. 1989
0.64
-0.076
-10.56%
1 janv. 1990
2.655
+2.016
315.13%
1 janv. 1991
5.677
+3.022
113.82%
1 janv. 1992
2.653
-3.023
-53.26%
1 janv. 1993
3.922
+1.269
47.81%
1 janv. 1994
3.823
-0.099
-2.52%
1 janv. 1995
2.924
-0.899
-23.52%
1 janv. 1996
3.323
+0.399
13.65%
1 janv. 1997
3.845
+0.522
15.7%
1 janv. 1998
3.692
-0.153
-3.98%
1 janv. 1999
1.683
-2.009
-54.41%
1 janv. 2000
4.4
+2.717
161.44%
1 janv. 2001
9.067
+4.666
106.05%
1 janv. 2002
7.86
-1.207
-13.31%
1 janv. 2003
5.771
-2.089
-26.57%
1 janv. 2004
5.627
-0.145
-2.51%
1 janv. 2005
6.256
+0.63
11.19%
1 janv. 2006
8.483
+2.227
35.6%
1 janv. 2007
7.454
-1.029
-12.13%
1 janv. 2008
7.689
+0.235
3.15%
1 janv. 2009
9.593
+1.904
24.76%
1 janv. 2010
4.073
-5.52
-57.55%
1 janv. 2011
5.379
+1.306
32.08%
1 janv. 2012
8.722
+3.343
62.15%
1 janv. 2013
7.38
-1.342
-15.39%
1 janv. 2014
6.769
-0.611
-8.28%
1 janv. 2015
6.093
-0.676
-9.99%
1 janv. 2016
2.039
-4.054
-66.53%
Classement des pays selon les statistiques actuelles par années

Commentaires:

Envoyer
PremiumAbout & FeedbackUn accordConfidentialité
logo
© 2022 Selected Technologies LLC – Morgan Hill, California