29
/fr/
fr
AIzaSyAYiBZKx7MnpbEhh9jyipgxe19OcubqV5w
April 1, 2024
39284
IDA only
IDX
false
2
1
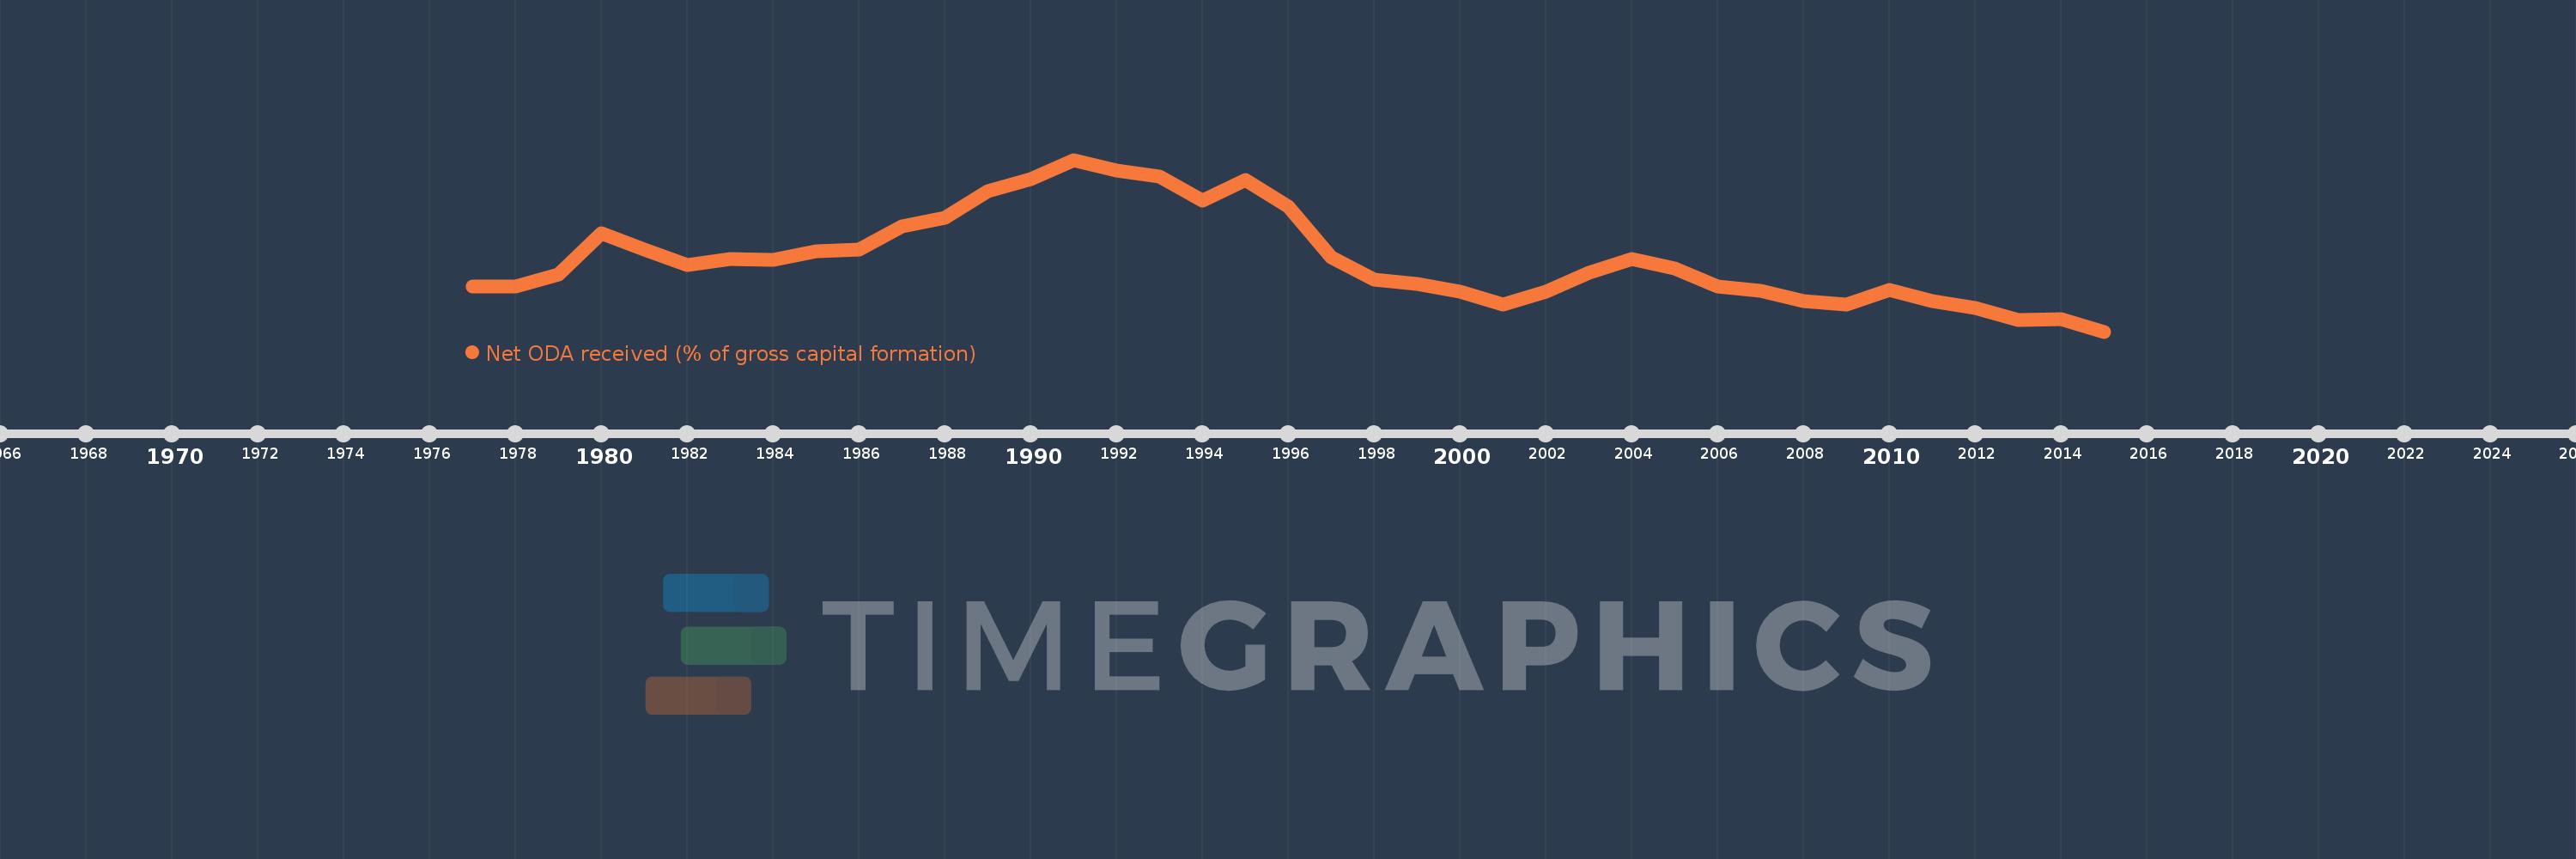
Net ODA received (% of gross capital formation)
2015,2014,2013,2012,2011,2010,2009,2008,2007,2006,2005,2004,2003,2002,2001,2000,1999,1998,1997,1996,1995,1994,1993,1992,1991,1990,1989,1988,1987,1986,1985,1984,1983,1982,1981,1980,1979,1978,1977
Cette statistique dans les autres pays:
AfghanistanAlbaniaAlgeriaAngolaAntigua and BarbudaArab WorldArgentinaArmeniaArubaAzerbaijanBahamas, TheBahrainBangladeshBarbadosBelarusBelizeBeninBhutanBoliviaBosnia and HerzegovinaBotswanaBrazilBrunei DarussalamBurkina FasoBurundiCabo VerdeCambodiaCameroonCaribbean small statesCentral African RepublicCentral Europe and the BalticsChadChileChinaColombiaComorosCongo, Dem. Rep.Congo, Rep.Costa RicaCote d'IvoireCroatiaCubaCyprusDjiboutiDominicaDominican RepublicEast Asia & PacificEast Asia & Pacific (excluding high income)East Asia & Pacific (IDA & IBRD countries)EcuadorEgypt, Arab Rep.El SalvadorEquatorial GuineaEritreaEthiopiaEuro areaEurope & Central AsiaEurope & Central Asia (excluding high income)Europe & Central Asia (IDA & IBRD countries)European UnionFijiFragile and conflict affected situationsGabonGambia, TheGeorgiaGhanaGrenadaGuatemalaGuineaGuinea-BissauGuyanaHaitiHeavily indebted poor countries (HIPC)High incomeHondurasHong Kong SAR, ChinaIBRD onlyIDA & IBRD totalIDA blendIDA onlyIDA totalIndiaIndonesiaIran, Islamic Rep.IraqIsraelJamaicaJordanKazakhstanKenyaKiribatiKorea, Rep.KosovoKuwaitKyrgyz RepublicLao PDRLatin America & Caribbean Latin America & Caribbean (excluding high income)Latin America & the Caribbean (IDA & IBRD countries)Least developed countries: UN classificationLebanonLesothoLiberiaLibyaLow & middle incomeLow incomeLower middle incomeMacao SAR, ChinaMacedonia, FYRMadagascarMalawiMalaysiaMaldivesMaliMaltaMauritaniaMauritiusMexicoMiddle East & North AfricaMiddle East & North Africa (excluding high income)Middle East & North Africa (IDA & IBRD countries)Middle incomeMoldovaMongoliaMontenegroMoroccoMozambiqueNamibiaNepalNew CaledoniaNicaraguaNigerNigeriaNorth AmericaOECD membersOmanOther small statesPakistanPanamaPapua New GuineaParaguayPeruPhilippinesQatarRwandaSaudi ArabiaSenegalSerbiaSeychellesSierra LeoneSingaporeSloveniaSmall statesSolomon IslandsSouth AfricaSouth AsiaSouth Asia (IDA & IBRD)South SudanSri LankaSt. Kitts and NevisSt. LuciaSt. Vincent and the GrenadinesSub-Saharan Africa Sub-Saharan Africa (excluding high income)Sub-Saharan Africa (IDA & IBRD countries)SudanSurinameSwazilandSyrian Arab RepublicTajikistanTanzaniaThailandTimor-LesteTogoTongaTrinidad and TobagoTunisiaTurkeyTurkmenistanUgandaUkraineUpper middle incomeUruguayUzbekistanVanuatuVenezuela, RBVietnamWest Bank and GazaWorldYemen, Rep.ZambiaZimbabwe La ligne de temps
Cette échelle de temps montre un graphique de 1977 année à 2015 année IDA only. Les données jusqu'à 1976 année ne sont pas présentés. Quantité d'observations actuelles selon dates: 39.
Source (désignation):
Les indicateurs du développement mondiale
Source (organisation):
Development Assistance Committee of the Organisation for Economic Co-operation and Development, Geographical Distribution of Financial Flows to Developing Countries, Development Co-operation Report, and International Development Statistics database. Data are available online at: www.oecd.org/dac/stats/idsonline. World Bank gross capital formation estimates are used for the denominator.
Catégories:
Aid Effectiveness
Dernière mise à jour
23 avr. 2017
Les indicateurs de changement de valeurs selon les années
Minimum:
19.57
1 janv. 2015
Maximum:
66.627
1 janv. 1991
Pour la date d''observation
Valeur
Changement absolu
Le changement par rapport à la valeur précédente
1 janv. 1977
31.851
+31.851
0.0%
1 janv. 1978
31.812
-0.039
-0.12%
1 janv. 1979
35.305
+3.493
10.98%
1 janv. 1980
46.446
+11.141
31.56%
1 janv. 1981
42.073
-4.373
-9.41%
1 janv. 1982
37.844
-4.23
-10.05%
1 janv. 1983
39.446
+1.602
4.23%
1 janv. 1984
39.274
-0.172
-0.44%
1 janv. 1985
41.577
+2.303
5.86%
1 janv. 1986
41.954
+0.377
0.91%
1 janv. 1987
48.447
+6.493
15.48%
1 janv. 1988
50.797
+2.35
4.85%
1 janv. 1989
58.101
+7.304
14.38%
1 janv. 1990
61.447
+3.346
5.76%
1 janv. 1991
66.627
+5.18
8.43%
1 janv. 1992
63.602
-3.025
-4.54%
1 janv. 1993
62.032
-1.57
-2.47%
1 janv. 1994
55.425
-6.607
-10.65%
1 janv. 1995
61.195
+5.769
10.41%
1 janv. 1996
53.811
-7.384
-12.07%
1 janv. 1997
39.877
-13.933
-25.89%
1 janv. 1998
33.741
-6.137
-15.39%
1 janv. 1999
32.732
-1.009
-2.99%
1 janv. 2000
30.621
-2.111
-6.45%
1 janv. 2001
27.05
-3.571
-11.66%
1 janv. 2002
30.417
+3.368
12.45%
1 janv. 2003
35.701
+5.284
17.37%
1 janv. 2004
39.508
+3.807
10.66%
1 janv. 2005
36.875
-2.633
-6.66%
1 janv. 2006
31.963
-4.912
-13.32%
1 janv. 2007
30.681
-1.282
-4.01%
1 janv. 2008
27.833
-2.848
-9.28%
1 janv. 2009
26.998
-0.834
-3.0%
1 janv. 2010
31.003
+4.005
14.83%
1 janv. 2011
27.807
-3.196
-10.31%
1 janv. 2012
25.925
-1.882
-6.77%
1 janv. 2013
22.651
-3.274
-12.63%
1 janv. 2014
23.085
+0.434
1.92%
1 janv. 2015
19.57
-3.515
-15.23%
Classement des pays selon les statistiques actuelles par années


Commentaires: