29
/fr/
fr
AIzaSyAYiBZKx7MnpbEhh9jyipgxe19OcubqV5w
April 1, 2024
156395
Indonesia
IDN
true
2
1
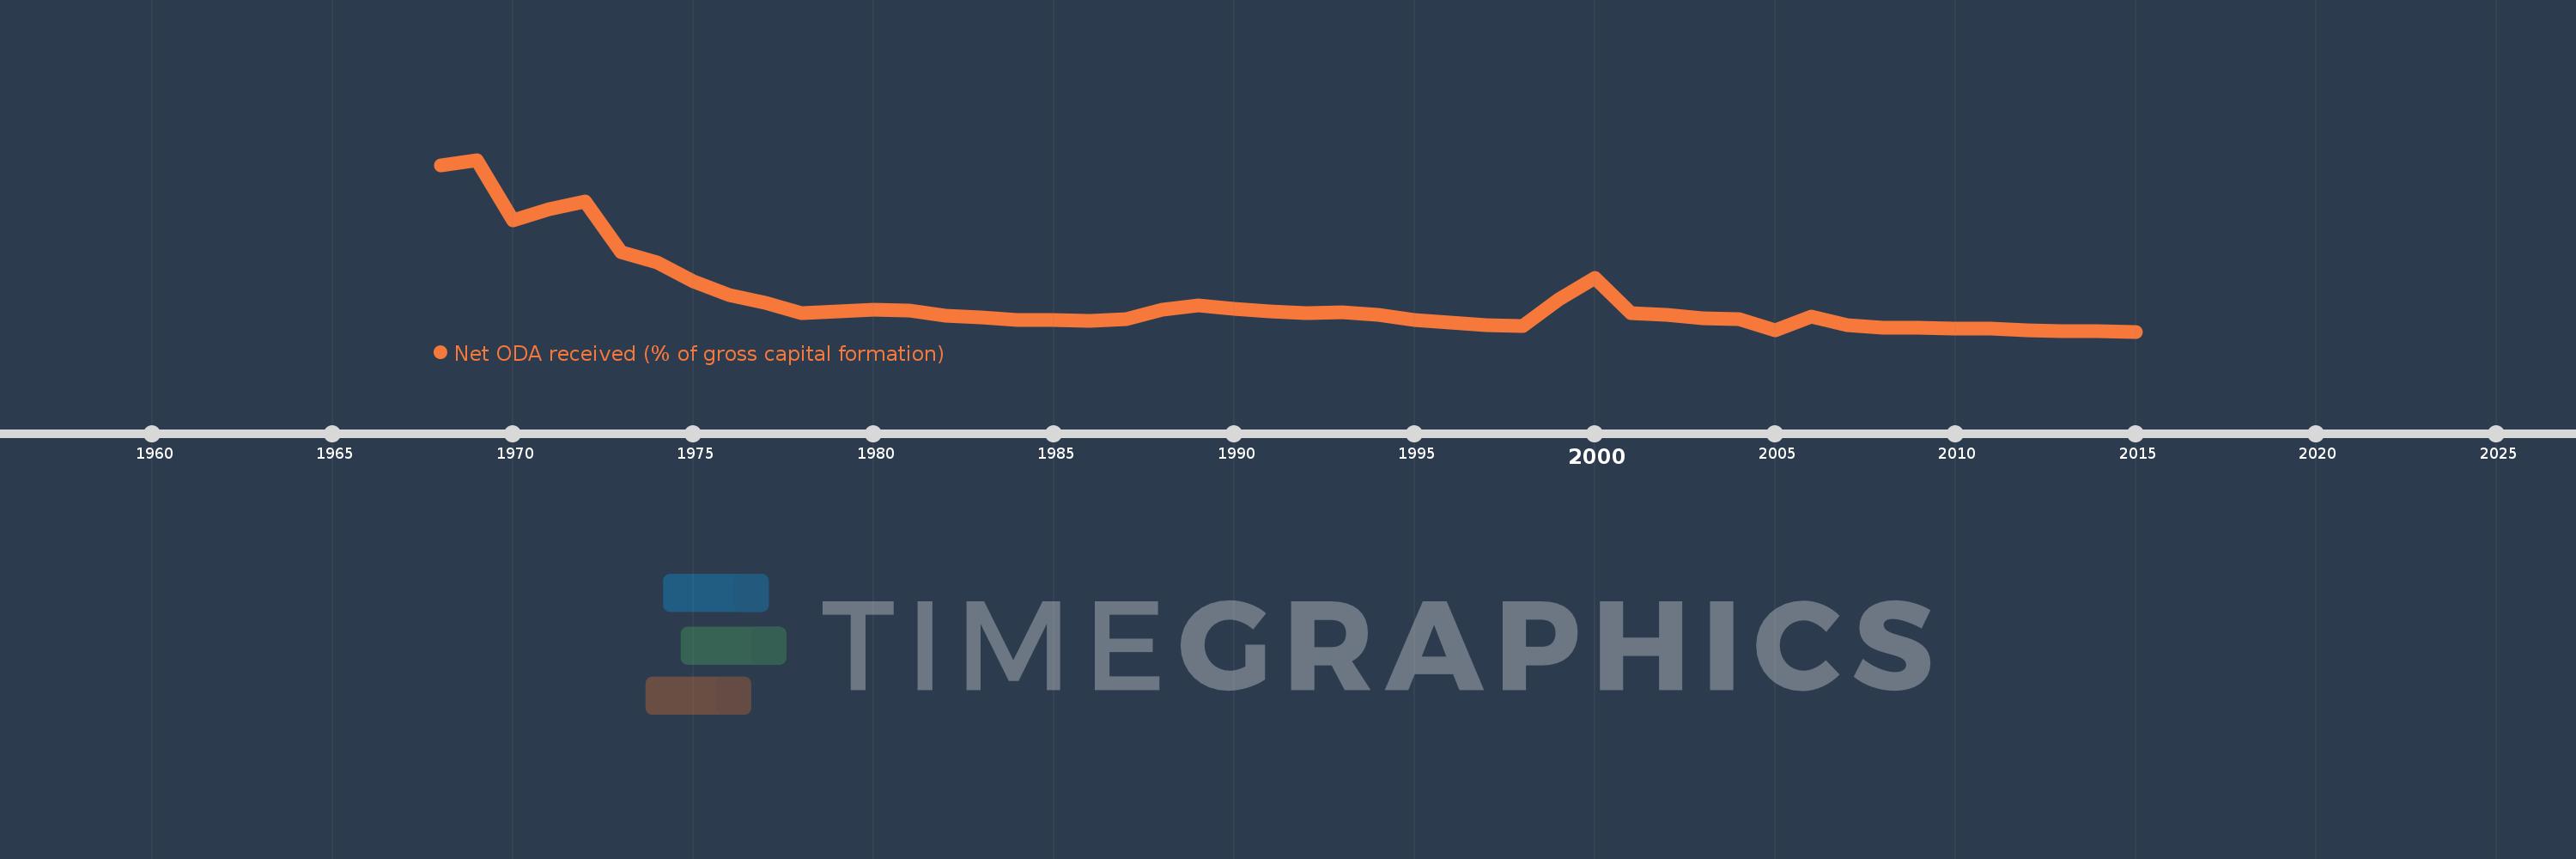
Net ODA received (% of gross capital formation)
2015,2014,2013,2012,2011,2010,2009,2008,2007,2006,2005,2004,2003,2002,2001,2000,1999,1998,1997,1996,1995,1994,1993,1992,1991,1990,1989,1988,1987,1986,1985,1984,1983,1982,1981,1980,1979,1978,1977,1976,1975,1974,1973,1972,1971,1970,1969,1968
Cette statistique dans les autres pays:
AfghanistanAlbaniaAlgeriaAngolaAntigua and BarbudaArab WorldArgentinaArmeniaArubaAzerbaijanBahamas, TheBahrainBangladeshBarbadosBelarusBelizeBeninBhutanBoliviaBosnia and HerzegovinaBotswanaBrazilBrunei DarussalamBurkina FasoBurundiCabo VerdeCambodiaCameroonCaribbean small statesCentral African RepublicCentral Europe and the BalticsChadChileChinaColombiaComorosCongo, Dem. Rep.Congo, Rep.Costa RicaCote d'IvoireCroatiaCubaCyprusDjiboutiDominicaDominican RepublicEast Asia & PacificEast Asia & Pacific (excluding high income)East Asia & Pacific (IDA & IBRD countries)EcuadorEgypt, Arab Rep.El SalvadorEquatorial GuineaEritreaEthiopiaEuro areaEurope & Central AsiaEurope & Central Asia (excluding high income)Europe & Central Asia (IDA & IBRD countries)European UnionFijiFragile and conflict affected situationsGabonGambia, TheGeorgiaGhanaGrenadaGuatemalaGuineaGuinea-BissauGuyanaHaitiHeavily indebted poor countries (HIPC)High incomeHondurasHong Kong SAR, ChinaIBRD onlyIDA & IBRD totalIDA blendIDA onlyIDA totalIndiaIndonesiaIran, Islamic Rep.IraqIsraelJamaicaJordanKazakhstanKenyaKiribatiKorea, Rep.KosovoKuwaitKyrgyz RepublicLao PDRLatin America & Caribbean Latin America & Caribbean (excluding high income)Latin America & the Caribbean (IDA & IBRD countries)Least developed countries: UN classificationLebanonLesothoLiberiaLibyaLow & middle incomeLow incomeLower middle incomeMacao SAR, ChinaMacedonia, FYRMadagascarMalawiMalaysiaMaldivesMaliMaltaMauritaniaMauritiusMexicoMiddle East & North AfricaMiddle East & North Africa (excluding high income)Middle East & North Africa (IDA & IBRD countries)Middle incomeMoldovaMongoliaMontenegroMoroccoMozambiqueNamibiaNepalNew CaledoniaNicaraguaNigerNigeriaNorth AmericaOECD membersOmanOther small statesPakistanPanamaPapua New GuineaParaguayPeruPhilippinesQatarRwandaSaudi ArabiaSenegalSerbiaSeychellesSierra LeoneSingaporeSloveniaSmall statesSolomon IslandsSouth AfricaSouth AsiaSouth Asia (IDA & IBRD)South SudanSri LankaSt. Kitts and NevisSt. LuciaSt. Vincent and the GrenadinesSub-Saharan Africa Sub-Saharan Africa (excluding high income)Sub-Saharan Africa (IDA & IBRD countries)SudanSurinameSwazilandSyrian Arab RepublicTajikistanTanzaniaThailandTimor-LesteTogoTongaTrinidad and TobagoTunisiaTurkeyTurkmenistanUgandaUkraineUpper middle incomeUruguayUzbekistanVanuatuVenezuela, RBVietnamWest Bank and GazaWorldYemen, Rep.ZambiaZimbabwe La ligne de temps
Cette échelle de temps montre un graphique de 1968 année à 2015 année Indonesia. Les données jusqu'à 1967 année ne sont pas présentés. Quantité d'observations actuelles selon dates: 48.
Source (désignation):
Les indicateurs du développement mondiale
Source (organisation):
Development Assistance Committee of the Organisation for Economic Co-operation and Development, Geographical Distribution of Financial Flows to Developing Countries, Development Co-operation Report, and International Development Statistics database. Data are available online at: www.oecd.org/dac/stats/idsonline. World Bank gross capital formation estimates are used for the denominator.
Catégories:
Aid Effectiveness
Dernière mise à jour
23 avr. 2017
Les indicateurs de changement de valeurs selon les années
Minimum:
-0.126
1 janv. 2015
Maximum:
42.631
1 janv. 1969
Pour la date d''observation
Valeur
Changement absolu
Le changement par rapport à la valeur précédente
1 janv. 1968
41.177
+41.177
0.0%
1 janv. 1969
42.631
+1.454
3.53%
1 janv. 1970
27.51
-15.121
-35.47%
1 janv. 1971
30.421
+2.911
10.58%
1 janv. 1972
32.34
+1.919
6.31%
1 janv. 1973
19.682
-12.658
-39.14%
1 janv. 1974
17.151
-2.531
-12.86%
1 janv. 1975
12.427
-4.724
-27.54%
1 janv. 1976
9.026
-3.401
-27.37%
1 janv. 1977
7.032
-1.994
-22.09%
1 janv. 1978
4.532
-2.5
-35.55%
1 janv. 1979
4.865
+0.333
7.35%
1 janv. 1980
5.253
+0.388
7.98%
1 janv. 1981
5.013
-0.24
-4.57%
1 janv. 1982
3.918
-1.095
-21.84%
1 janv. 1983
3.413
-0.506
-12.91%
1 janv. 1984
2.759
-0.654
-19.16%
1 janv. 1985
2.833
+0.075
2.7%
1 janv. 1986
2.444
-0.389
-13.72%
1 janv. 1987
2.978
+0.534
21.84%
1 janv. 1988
5.407
+2.429
81.54%
1 janv. 1989
6.348
+0.941
17.4%
1 janv. 1990
5.542
-0.806
-12.7%
1 janv. 1991
4.89
-0.652
-11.77%
1 janv. 1992
4.511
-0.378
-7.73%
1 janv. 1993
4.644
+0.133
2.95%
1 janv. 1994
4.147
-0.497
-10.7%
1 janv. 1995
2.818
-1.329
-32.04%
1 janv. 1996
2.016
-0.802
-28.47%
1 janv. 1997
1.534
-0.482
-23.91%
1 janv. 1998
1.176
-0.358
-23.36%
1 janv. 1999
7.833
+6.657
566.13%
1 janv. 2000
13.338
+5.505
70.28%
1 janv. 2001
4.503
-8.835
-66.24%
1 janv. 2002
4.051
-0.452
-10.05%
1 janv. 2003
3.115
-0.935
-23.09%
1 janv. 2004
2.948
-0.167
-5.38%
1 janv. 2005
0.213
-2.734
-92.76%
1 janv. 2006
3.534
+3.321
1.56 milles%
1 janv. 2007
1.424
-2.111
-59.72%
1 janv. 2008
0.839
-0.584
-41.05%
1 janv. 2009
0.867
+0.028
3.33%
1 janv. 2010
0.626
-0.241
-27.81%
1 janv. 2011
0.56
-0.066
-10.59%
1 janv. 2012
0.137
-0.422
-75.44%
1 janv. 2013
0.02
-0.117
-85.39%
1 janv. 2014
0.021
+0.001
4.52%
1 janv. 2015
-0.126
-0.147
-701.12%
Classement des pays selon les statistiques actuelles par années


Commentaires: