29
/fr/
fr
AIzaSyAYiBZKx7MnpbEhh9jyipgxe19OcubqV5w
April 1, 2024
213353
Nigeria
NGA
true
2
1
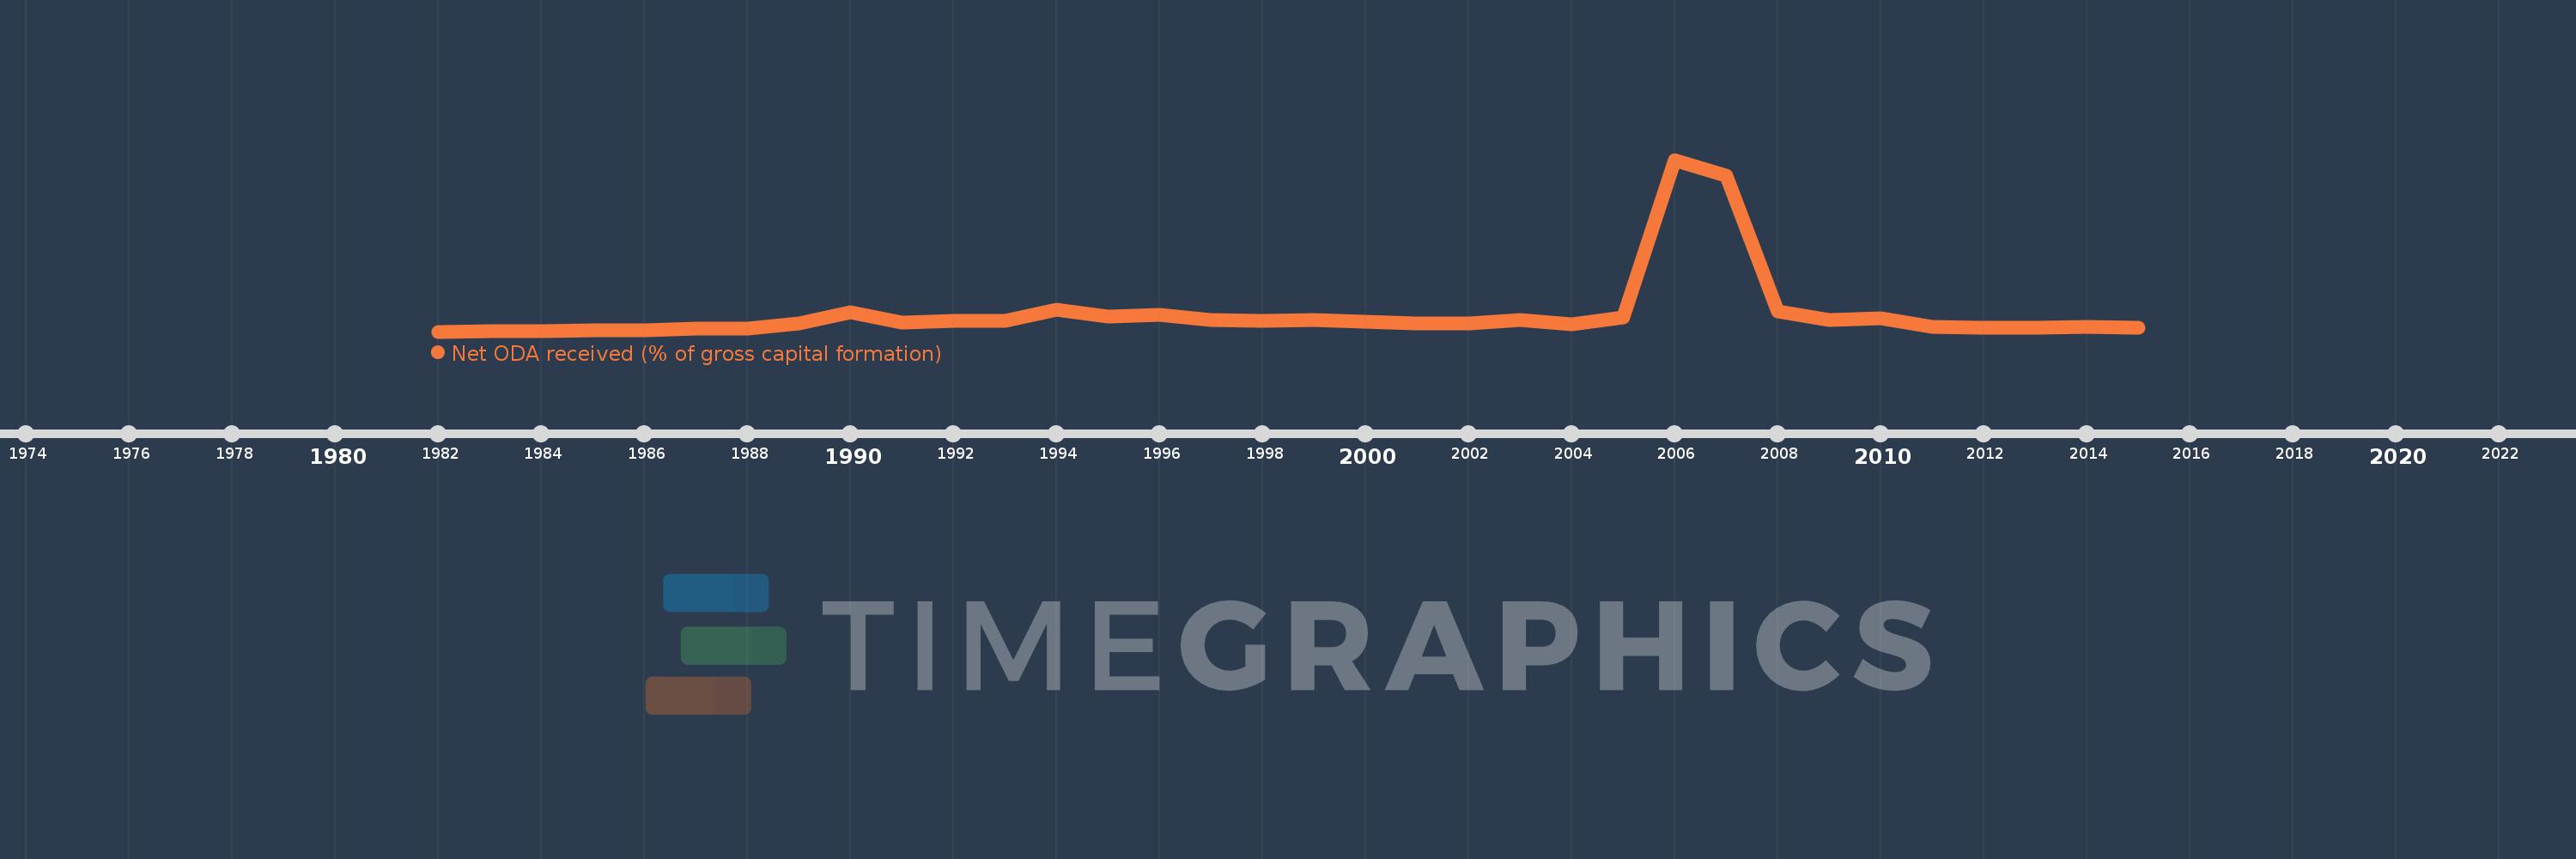
Net ODA received (% of gross capital formation)
2015,2014,2013,2012,2011,2010,2009,2008,2007,2006,2005,2004,2003,2002,2001,2000,1999,1998,1997,1996,1995,1994,1993,1992,1991,1990,1989,1988,1987,1986,1985,1984,1983,1982
Cette statistique dans les autres pays:
AfghanistanAlbaniaAlgeriaAngolaAntigua and BarbudaArab WorldArgentinaArmeniaArubaAzerbaijanBahamas, TheBahrainBangladeshBarbadosBelarusBelizeBeninBhutanBoliviaBosnia and HerzegovinaBotswanaBrazilBrunei DarussalamBurkina FasoBurundiCabo VerdeCambodiaCameroonCaribbean small statesCentral African RepublicCentral Europe and the BalticsChadChileChinaColombiaComorosCongo, Dem. Rep.Congo, Rep.Costa RicaCote d'IvoireCroatiaCubaCyprusDjiboutiDominicaDominican RepublicEast Asia & PacificEast Asia & Pacific (excluding high income)East Asia & Pacific (IDA & IBRD countries)EcuadorEgypt, Arab Rep.El SalvadorEquatorial GuineaEritreaEthiopiaEuro areaEurope & Central AsiaEurope & Central Asia (excluding high income)Europe & Central Asia (IDA & IBRD countries)European UnionFijiFragile and conflict affected situationsGabonGambia, TheGeorgiaGhanaGrenadaGuatemalaGuineaGuinea-BissauGuyanaHaitiHeavily indebted poor countries (HIPC)High incomeHondurasHong Kong SAR, ChinaIBRD onlyIDA & IBRD totalIDA blendIDA onlyIDA totalIndiaIndonesiaIran, Islamic Rep.IraqIsraelJamaicaJordanKazakhstanKenyaKiribatiKorea, Rep.KosovoKuwaitKyrgyz RepublicLao PDRLatin America & Caribbean Latin America & Caribbean (excluding high income)Latin America & the Caribbean (IDA & IBRD countries)Least developed countries: UN classificationLebanonLesothoLiberiaLibyaLow & middle incomeLow incomeLower middle incomeMacao SAR, ChinaMacedonia, FYRMadagascarMalawiMalaysiaMaldivesMaliMaltaMauritaniaMauritiusMexicoMiddle East & North AfricaMiddle East & North Africa (excluding high income)Middle East & North Africa (IDA & IBRD countries)Middle incomeMoldovaMongoliaMontenegroMoroccoMozambiqueNamibiaNepalNew CaledoniaNicaraguaNigerNigeriaNorth AmericaOECD membersOmanOther small statesPakistanPanamaPapua New GuineaParaguayPeruPhilippinesQatarRwandaSaudi ArabiaSenegalSerbiaSeychellesSierra LeoneSingaporeSloveniaSmall statesSolomon IslandsSouth AfricaSouth AsiaSouth Asia (IDA & IBRD)South SudanSri LankaSt. Kitts and NevisSt. LuciaSt. Vincent and the GrenadinesSub-Saharan Africa Sub-Saharan Africa (excluding high income)Sub-Saharan Africa (IDA & IBRD countries)SudanSurinameSwazilandSyrian Arab RepublicTajikistanTanzaniaThailandTimor-LesteTogoTongaTrinidad and TobagoTunisiaTurkeyTurkmenistanUgandaUkraineUpper middle incomeUruguayUzbekistanVanuatuVenezuela, RBVietnamWest Bank and GazaWorldYemen, Rep.ZambiaZimbabwe La ligne de temps
Cette échelle de temps montre un graphique de 1982 année à 2015 année Nigeria. Les données jusqu'à 1981 année ne sont pas présentés. Quantité d'observations actuelles selon dates: 34.
Source (désignation):
Les indicateurs du développement mondiale
Source (organisation):
Development Assistance Committee of the Organisation for Economic Co-operation and Development, Geographical Distribution of Financial Flows to Developing Countries, Development Co-operation Report, and International Development Statistics database. Data are available online at: www.oecd.org/dac/stats/idsonline. World Bank gross capital formation estimates are used for the denominator.
Catégories:
Aid Effectiveness
Dernière mise à jour
23 avr. 2017
Les indicateurs de changement de valeurs selon les années
Minimum:
0.189
1 janv. 1982
Maximum:
104.435
1 janv. 2006
Pour la date d''observation
Valeur
Changement absolu
Le changement par rapport à la valeur précédente
1 janv. 1982
0.189
+0.189
0.0%
1 janv. 1983
0.229
+0.04
21.05%
1 janv. 1984
0.603
+0.374
163.65%
1 janv. 1985
0.915
+0.312
51.78%
1 janv. 1986
0.967
+0.052
5.68%
1 janv. 1987
1.786
+0.819
84.73%
1 janv. 1988
2.216
+0.43
24.07%
1 janv. 1989
5.152
+2.936
132.47%
1 janv. 1990
12.086
+6.934
134.58%
1 janv. 1991
5.748
-6.337
-52.44%
1 janv. 1992
6.837
+1.088
18.94%
1 janv. 1993
6.9
+0.063
0.92%
1 janv. 1994
13.419
+6.519
94.48%
1 janv. 1995
9.366
-4.053
-30.2%
1 janv. 1996
10.433
+1.067
11.39%
1 janv. 1997
7.386
-3.047
-29.2%
1 janv. 1998
6.66
-0.726
-9.83%
1 janv. 1999
7.364
+0.703
10.56%
1 janv. 2000
6.036
-1.328
-18.04%
1 janv. 2001
5.326
-0.71
-11.76%
1 janv. 2002
5.256
-0.07
-1.31%
1 janv. 2003
7.179
+1.923
36.58%
1 janv. 2004
4.595
-2.583
-35.98%
1 janv. 2005
8.874
+4.278
93.1%
1 janv. 2006
104.435
+95.562
1.08 milles%
1 janv. 2007
94.977
-9.459
-9.06%
1 janv. 2008
12.697
-82.28
-86.63%
1 janv. 2009
7.444
-5.253
-41.37%
1 janv. 2010
8.084
+0.64
8.6%
1 janv. 2011
3.225
-4.859
-60.11%
1 janv. 2012
2.644
-0.581
-18.02%
1 janv. 2013
2.782
+0.138
5.23%
1 janv. 2014
3.277
+0.495
17.8%
1 janv. 2015
2.756
-0.521
-15.89%
Classement des pays selon les statistiques actuelles par années


Commentaires: