29
/fr/
fr
AIzaSyAYiBZKx7MnpbEhh9jyipgxe19OcubqV5w
April 1, 2024
215609
Oman
OMN
true
2
1
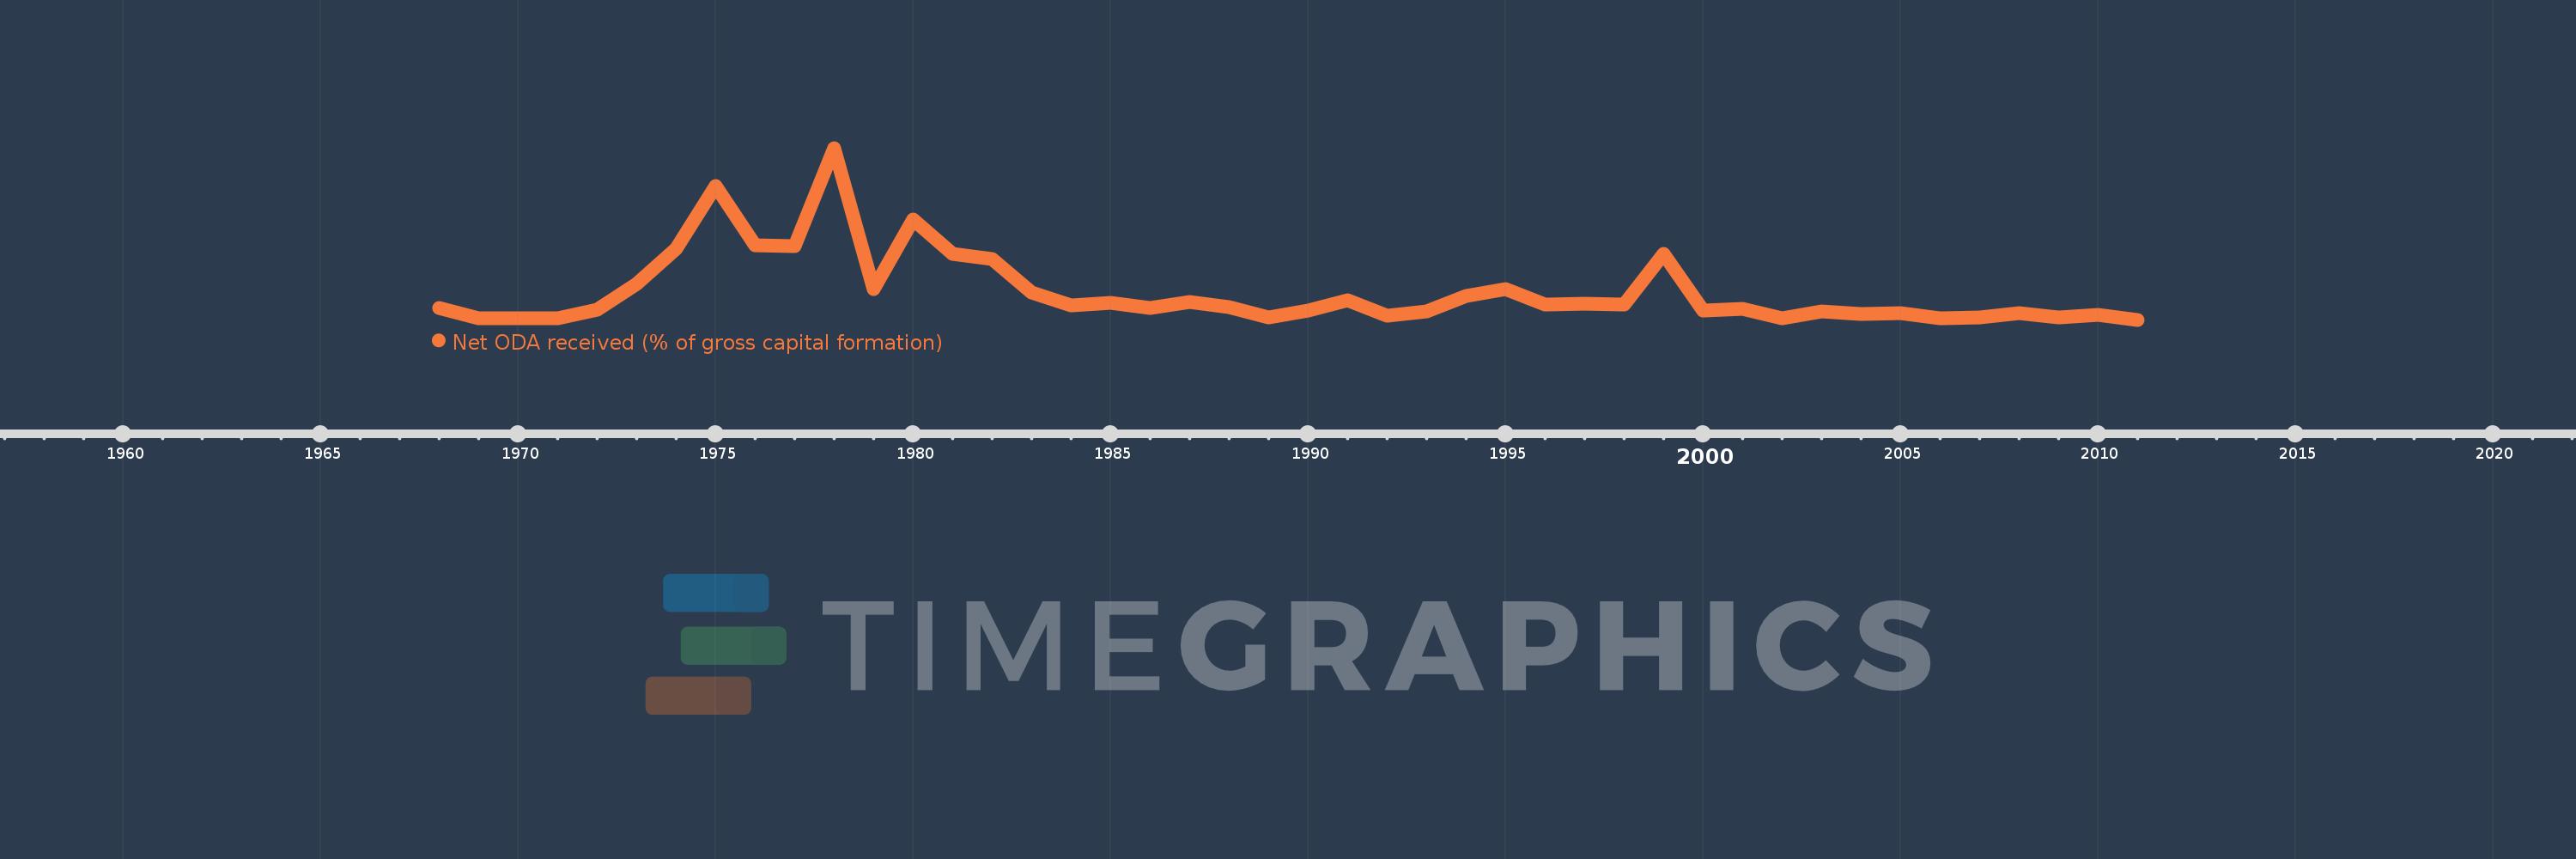
Net ODA received (% of gross capital formation)
2011,2010,2009,2008,2007,2006,2005,2004,2003,2002,2001,2000,1999,1998,1997,1996,1995,1994,1993,1992,1991,1990,1989,1988,1987,1986,1985,1984,1983,1982,1981,1980,1979,1978,1977,1976,1975,1974,1973,1972,1971,1970,1969,1968
Cette statistique dans les autres pays:
AfghanistanAlbaniaAlgeriaAngolaAntigua and BarbudaArab WorldArgentinaArmeniaArubaAzerbaijanBahamas, TheBahrainBangladeshBarbadosBelarusBelizeBeninBhutanBoliviaBosnia and HerzegovinaBotswanaBrazilBrunei DarussalamBurkina FasoBurundiCabo VerdeCambodiaCameroonCaribbean small statesCentral African RepublicCentral Europe and the BalticsChadChileChinaColombiaComorosCongo, Dem. Rep.Congo, Rep.Costa RicaCote d'IvoireCroatiaCubaCyprusDjiboutiDominicaDominican RepublicEast Asia & PacificEast Asia & Pacific (excluding high income)East Asia & Pacific (IDA & IBRD countries)EcuadorEgypt, Arab Rep.El SalvadorEquatorial GuineaEritreaEthiopiaEuro areaEurope & Central AsiaEurope & Central Asia (excluding high income)Europe & Central Asia (IDA & IBRD countries)European UnionFijiFragile and conflict affected situationsGabonGambia, TheGeorgiaGhanaGrenadaGuatemalaGuineaGuinea-BissauGuyanaHaitiHeavily indebted poor countries (HIPC)High incomeHondurasHong Kong SAR, ChinaIBRD onlyIDA & IBRD totalIDA blendIDA onlyIDA totalIndiaIndonesiaIran, Islamic Rep.IraqIsraelJamaicaJordanKazakhstanKenyaKiribatiKorea, Rep.KosovoKuwaitKyrgyz RepublicLao PDRLatin America & Caribbean Latin America & Caribbean (excluding high income)Latin America & the Caribbean (IDA & IBRD countries)Least developed countries: UN classificationLebanonLesothoLiberiaLibyaLow & middle incomeLow incomeLower middle incomeMacao SAR, ChinaMacedonia, FYRMadagascarMalawiMalaysiaMaldivesMaliMaltaMauritaniaMauritiusMexicoMiddle East & North AfricaMiddle East & North Africa (excluding high income)Middle East & North Africa (IDA & IBRD countries)Middle incomeMoldovaMongoliaMontenegroMoroccoMozambiqueNamibiaNepalNew CaledoniaNicaraguaNigerNigeriaNorth AmericaOECD membersOmanOther small statesPakistanPanamaPapua New GuineaParaguayPeruPhilippinesQatarRwandaSaudi ArabiaSenegalSerbiaSeychellesSierra LeoneSingaporeSloveniaSmall statesSolomon IslandsSouth AfricaSouth AsiaSouth Asia (IDA & IBRD)South SudanSri LankaSt. Kitts and NevisSt. LuciaSt. Vincent and the GrenadinesSub-Saharan Africa Sub-Saharan Africa (excluding high income)Sub-Saharan Africa (IDA & IBRD countries)SudanSurinameSwazilandSyrian Arab RepublicTajikistanTanzaniaThailandTimor-LesteTogoTongaTrinidad and TobagoTunisiaTurkeyTurkmenistanUgandaUkraineUpper middle incomeUruguayUzbekistanVanuatuVenezuela, RBVietnamWest Bank and GazaWorldYemen, Rep.ZambiaZimbabwe La ligne de temps
Cette échelle de temps montre un graphique de 1968 année à 2011 année Oman. Les données jusqu'à 1967 année ne sont pas présentés. Quantité d'observations actuelles selon dates: 44.
Source (désignation):
Les indicateurs du développement mondiale
Source (organisation):
Development Assistance Committee of the Organisation for Economic Co-operation and Development, Geographical Distribution of Financial Flows to Developing Countries, Development Co-operation Report, and International Development Statistics database. Data are available online at: www.oecd.org/dac/stats/idsonline. World Bank gross capital formation estimates are used for the denominator.
Catégories:
Aid Effectiveness
Dernière mise à jour
23 avr. 2017
Les indicateurs de changement de valeurs selon les années
Minimum:
-0.145
1 janv. 2011
Maximum:
43.279
1 janv. 1978
Pour la date d''observation
Valeur
Changement absolu
Le changement par rapport à la valeur précédente
1 janv. 1968
2.813
+2.813
0.0%
1 janv. 1969
0.21
-2.603
-92.52%
1 janv. 1970
0.179
-0.031
-14.84%
1 janv. 1971
0.198
+0.019
10.71%
1 janv. 1972
2.382
+2.183
1.1 milles%
1 janv. 1973
9.01
+6.629
278.34%
1 janv. 1974
17.804
+8.793
97.59%
1 janv. 1975
33.653
+15.85
89.03%
1 janv. 1976
18.76
-14.893
-44.25%
1 janv. 1977
18.565
-0.195
-1.04%
1 janv. 1978
43.279
+24.714
133.12%
1 janv. 1979
7.656
-35.624
-82.31%
1 janv. 1980
25.111
+17.455
228.01%
1 janv. 1981
16.447
-8.664
-34.5%
1 janv. 1982
15.122
-1.326
-8.06%
1 janv. 1983
6.796
-8.326
-55.06%
1 janv. 1984
3.391
-3.405
-50.1%
1 janv. 1985
4.026
+0.635
18.72%
1 janv. 1986
2.811
-1.214
-30.16%
1 janv. 1987
4.416
+1.604
57.06%
1 janv. 1988
3.061
-1.355
-30.69%
1 janv. 1989
0.384
-2.677
-87.46%
1 janv. 1990
2.137
+1.753
457.03%
1 janv. 1991
4.727
+2.589
121.16%
1 janv. 1992
0.768
-3.958
-83.74%
1 janv. 1993
1.946
+1.178
153.26%
1 janv. 1994
5.92
+3.974
204.19%
1 janv. 1995
7.644
+1.725
29.13%
1 janv. 1996
3.632
-4.013
-52.49%
1 janv. 1997
3.964
+0.332
9.14%
1 janv. 1998
3.593
-0.371
-9.36%
1 janv. 1999
16.453
+12.86
357.96%
1 janv. 2000
2.278
-14.175
-86.15%
1 janv. 2001
2.657
+0.379
16.63%
1 janv. 2002
0.248
-2.409
-90.66%
1 janv. 2003
2.022
+1.774
714.8%
1 janv. 2004
1.281
-0.741
-36.65%
1 janv. 2005
1.459
+0.177
13.85%
1 janv. 2006
0.286
-1.173
-80.4%
1 janv. 2007
0.535
+0.249
87.16%
1 janv. 2008
1.483
+0.948
177.21%
1 janv. 2009
0.336
-1.147
-77.35%
1 janv. 2010
1.059
+0.723
215.15%
1 janv. 2011
-0.145
-1.204
-113.7%
Classement des pays selon les statistiques actuelles par années


Commentaires: