29
/fr/
fr
AIzaSyAYiBZKx7MnpbEhh9jyipgxe19OcubqV5w
April 1, 2024
36017
High income
HIC
false
2
1
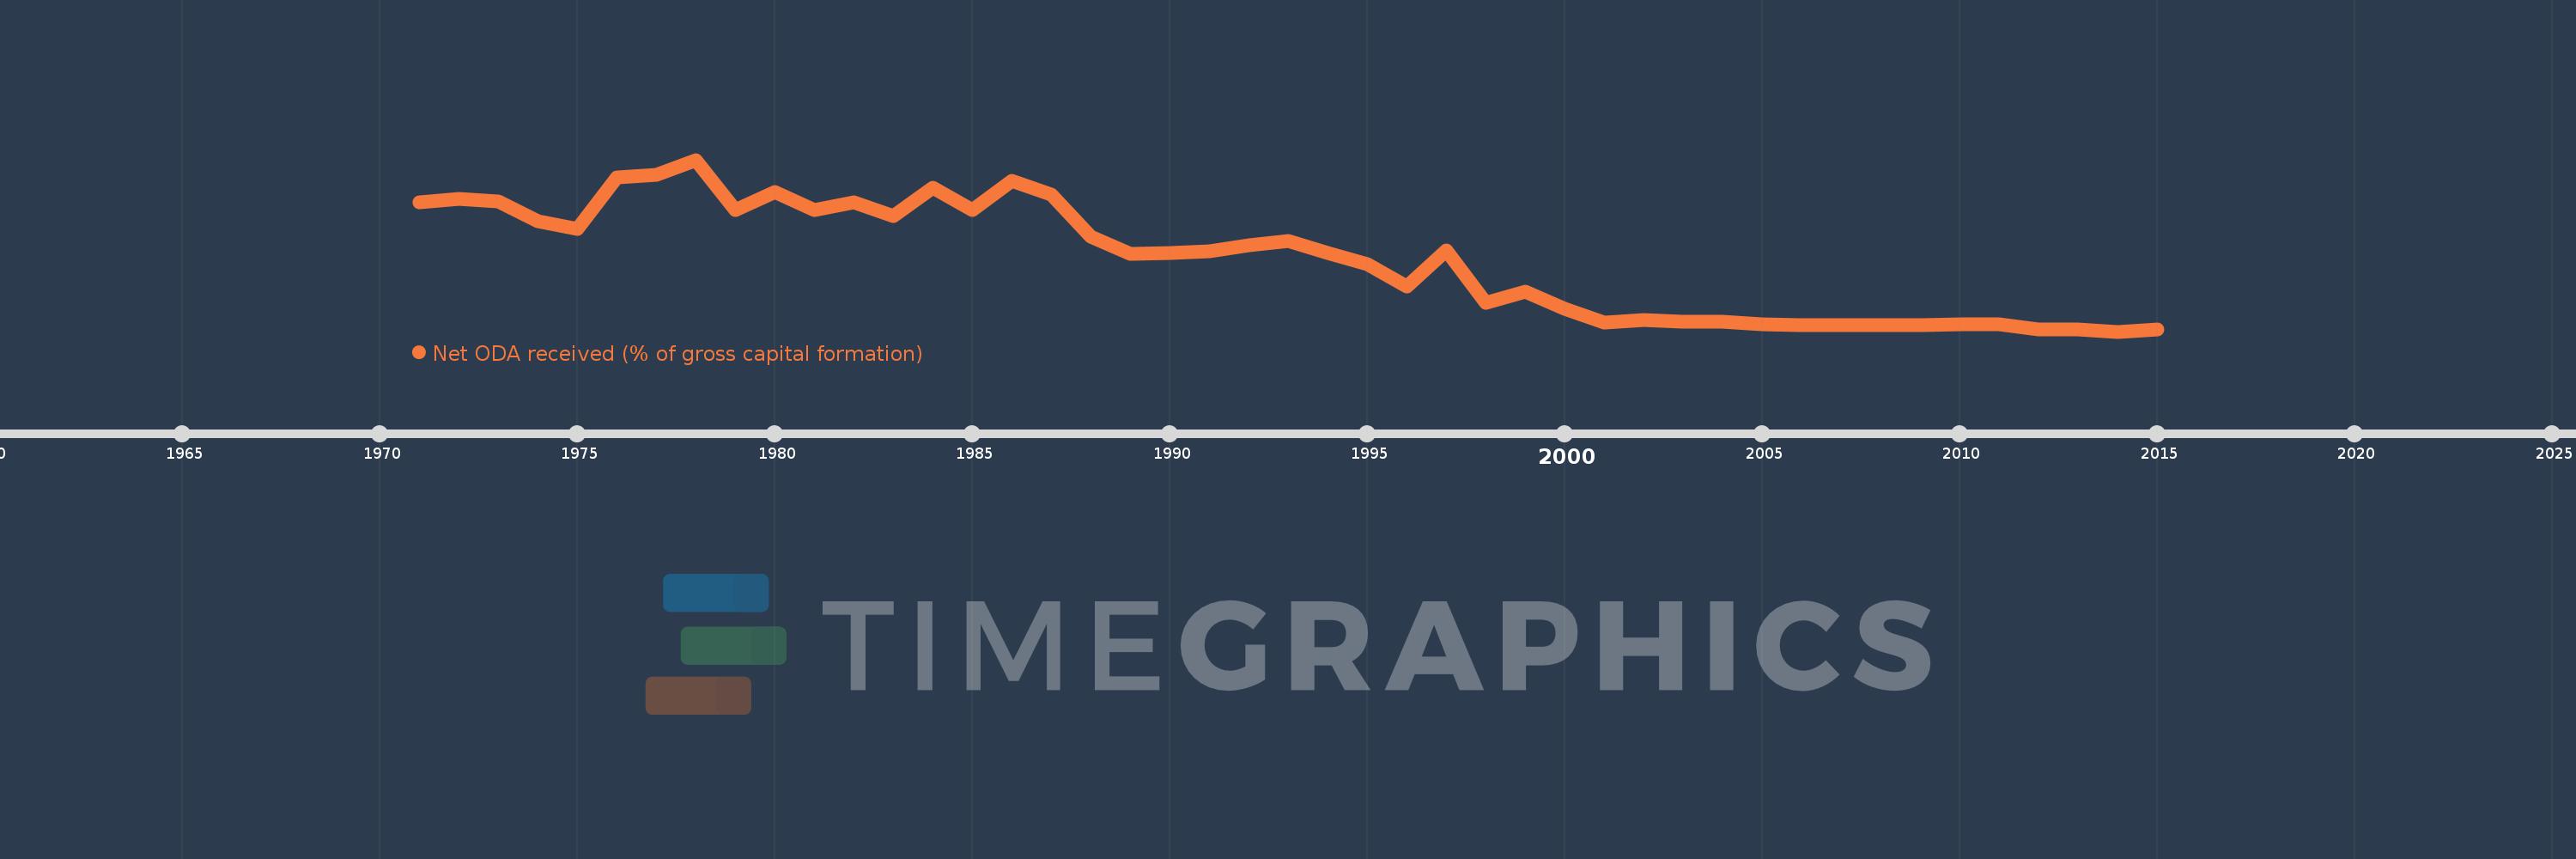
Net ODA received (% of gross capital formation)
2015,2014,2013,2012,2011,2010,2009,2008,2007,2006,2005,2004,2003,2002,2001,2000,1999,1998,1997,1996,1995,1994,1993,1992,1991,1990,1989,1988,1987,1986,1985,1984,1983,1982,1981,1980,1979,1978,1977,1976,1975,1974,1973,1972,1971
Cette statistique dans les autres pays:
AfghanistanAlbaniaAlgeriaAngolaAntigua and BarbudaArab WorldArgentinaArmeniaArubaAzerbaijanBahamas, TheBahrainBangladeshBarbadosBelarusBelizeBeninBhutanBoliviaBosnia and HerzegovinaBotswanaBrazilBrunei DarussalamBurkina FasoBurundiCabo VerdeCambodiaCameroonCaribbean small statesCentral African RepublicCentral Europe and the BalticsChadChileChinaColombiaComorosCongo, Dem. Rep.Congo, Rep.Costa RicaCote d'IvoireCroatiaCubaCyprusDjiboutiDominicaDominican RepublicEast Asia & PacificEast Asia & Pacific (excluding high income)East Asia & Pacific (IDA & IBRD countries)EcuadorEgypt, Arab Rep.El SalvadorEquatorial GuineaEritreaEthiopiaEuro areaEurope & Central AsiaEurope & Central Asia (excluding high income)Europe & Central Asia (IDA & IBRD countries)European UnionFijiFragile and conflict affected situationsGabonGambia, TheGeorgiaGhanaGrenadaGuatemalaGuineaGuinea-BissauGuyanaHaitiHeavily indebted poor countries (HIPC)High incomeHondurasHong Kong SAR, ChinaIBRD onlyIDA & IBRD totalIDA blendIDA onlyIDA totalIndiaIndonesiaIran, Islamic Rep.IraqIsraelJamaicaJordanKazakhstanKenyaKiribatiKorea, Rep.KosovoKuwaitKyrgyz RepublicLao PDRLatin America & Caribbean Latin America & Caribbean (excluding high income)Latin America & the Caribbean (IDA & IBRD countries)Least developed countries: UN classificationLebanonLesothoLiberiaLibyaLow & middle incomeLow incomeLower middle incomeMacao SAR, ChinaMacedonia, FYRMadagascarMalawiMalaysiaMaldivesMaliMaltaMauritaniaMauritiusMexicoMiddle East & North AfricaMiddle East & North Africa (excluding high income)Middle East & North Africa (IDA & IBRD countries)Middle incomeMoldovaMongoliaMontenegroMoroccoMozambiqueNamibiaNepalNew CaledoniaNicaraguaNigerNigeriaNorth AmericaOECD membersOmanOther small statesPakistanPanamaPapua New GuineaParaguayPeruPhilippinesQatarRwandaSaudi ArabiaSenegalSerbiaSeychellesSierra LeoneSingaporeSloveniaSmall statesSolomon IslandsSouth AfricaSouth AsiaSouth Asia (IDA & IBRD)South SudanSri LankaSt. Kitts and NevisSt. LuciaSt. Vincent and the GrenadinesSub-Saharan Africa Sub-Saharan Africa (excluding high income)Sub-Saharan Africa (IDA & IBRD countries)SudanSurinameSwazilandSyrian Arab RepublicTajikistanTanzaniaThailandTimor-LesteTogoTongaTrinidad and TobagoTunisiaTurkeyTurkmenistanUgandaUkraineUpper middle incomeUruguayUzbekistanVanuatuVenezuela, RBVietnamWest Bank and GazaWorldYemen, Rep.ZambiaZimbabwe La ligne de temps
Cette échelle de temps montre un graphique de 1971 année à 2015 année High income. Les données jusqu'à 1970 année ne sont pas présentés. Quantité d'observations actuelles selon dates: 45.
Source (désignation):
Les indicateurs du développement mondiale
Source (organisation):
Development Assistance Committee of the Organisation for Economic Co-operation and Development, Geographical Distribution of Financial Flows to Developing Countries, Development Co-operation Report, and International Development Statistics database. Data are available online at: www.oecd.org/dac/stats/idsonline. World Bank gross capital formation estimates are used for the denominator.
Catégories:
Aid Effectiveness
Dernière mise à jour
23 avr. 2017
Les indicateurs de changement de valeurs selon les années
Minimum:
0.002
1 janv. 2014
Maximum:
0.139
1 janv. 1978
Pour la date d''observation
Valeur
Changement absolu
Le changement par rapport à la valeur précédente
1 janv. 1971
0.105
+0.105
0.0%
1 janv. 1972
0.108
+0.003
2.76%
1 janv. 1973
0.106
-0.001
-1.35%
1 janv. 1974
0.09
-0.016
-15.26%
1 janv. 1975
0.084
-0.006
-6.99%
1 janv. 1976
0.125
+0.041
49.07%
1 janv. 1977
0.127
+0.002
1.4%
1 janv. 1978
0.139
+0.013
9.94%
1 janv. 1979
0.099
-0.041
-29.22%
1 janv. 1980
0.113
+0.014
14.41%
1 janv. 1981
0.099
-0.014
-12.3%
1 janv. 1982
0.105
+0.006
6.0%
1 janv. 1983
0.094
-0.01
-10.0%
1 janv. 1984
0.117
+0.023
23.98%
1 janv. 1985
0.099
-0.017
-14.94%
1 janv. 1986
0.122
+0.022
22.18%
1 janv. 1987
0.111
-0.01
-8.32%
1 janv. 1988
0.078
-0.033
-29.8%
1 janv. 1989
0.064
-0.014
-18.27%
1 janv. 1990
0.065
+0.001
1.82%
1 janv. 1991
0.066
+0.001
0.88%
1 janv. 1992
0.071
+0.005
7.54%
1 janv. 1993
0.074
+0.003
4.13%
1 janv. 1994
0.065
-0.009
-11.56%
1 janv. 1995
0.056
-0.009
-14.22%
1 janv. 1996
0.038
-0.018
-31.91%
1 janv. 1997
0.067
+0.029
76.65%
1 janv. 1998
0.025
-0.043
-63.45%
1 janv. 1999
0.034
+0.01
39.06%
1 janv. 2000
0.02
-0.014
-40.38%
1 janv. 2001
0.009
-0.012
-56.81%
1 janv. 2002
0.011
+0.002
25.71%
1 janv. 2003
0.01
-0.001
-8.13%
1 janv. 2004
0.01
0.0
-2.15%
1 janv. 2005
0.008
-0.002
-24.27%
1 janv. 2006
0.007
-0.001
-11.34%
1 janv. 2007
0.007
+0.0
5.71%
1 janv. 2008
0.007
0.0
-4.5%
1 janv. 2009
0.007
+0.001
8.98%
1 janv. 2010
0.008
+0.001
15.47%
1 janv. 2011
0.008
-0.001
-7.28%
1 janv. 2012
0.004
-0.004
-49.91%
1 janv. 2013
0.004
+0.001
12.99%
1 janv. 2014
0.002
-0.002
-44.79%
1 janv. 2015
0.004
+0.002
66.29%
Classement des pays selon les statistiques actuelles par années


Commentaires: