29
/fr/
fr
AIzaSyAYiBZKx7MnpbEhh9jyipgxe19OcubqV5w
April 1, 2024
279798
Vanuatu
VUT
true
2
1
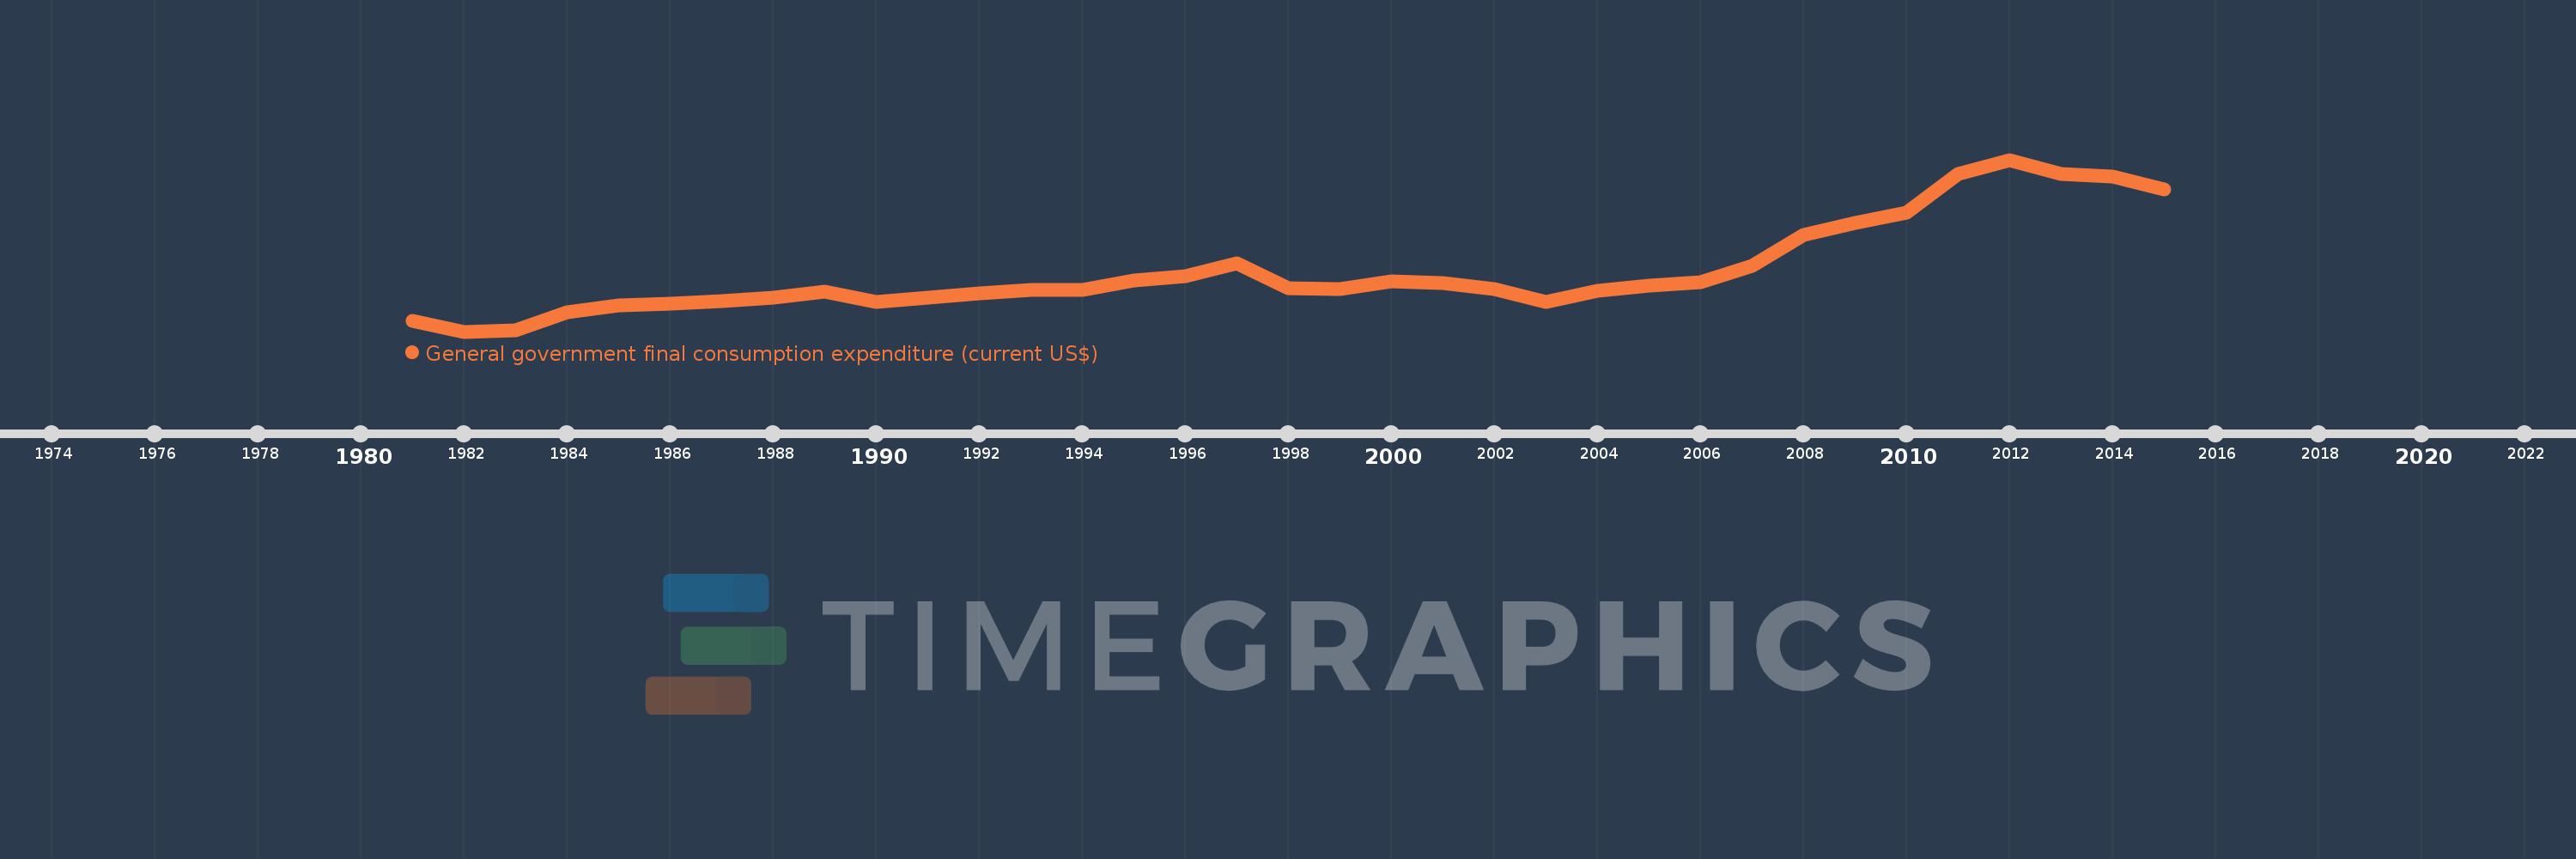
General government final consumption expenditure (current US$)
2015,2014,2013,2012,2011,2010,2009,2008,2007,2006,2005,2004,2003,2002,2001,2000,1999,1998,1997,1996,1995,1994,1993,1992,1991,1990,1989,1988,1987,1986,1985,1984,1983,1982,1981
Cette statistique dans les autres pays:
AfghanistanAlbaniaAlgeriaAngolaAntigua and BarbudaArab WorldArgentinaArmeniaArubaAustraliaAustriaAzerbaijanBahamas, TheBahrainBangladeshBarbadosBelarusBelgiumBelizeBeninBermudaBhutanBoliviaBosnia and HerzegovinaBotswanaBrazilBrunei DarussalamBulgariaBurkina FasoBurundiCabo VerdeCambodiaCameroonCanadaCaribbean small statesCentral African RepublicCentral Europe and the BalticsChadChileChinaColombiaComorosCongo, Dem. Rep.Congo, Rep.Costa RicaCote d'IvoireCroatiaCubaCyprusCzech RepublicDenmarkDjiboutiDominicaDominican RepublicEarly-demographic dividendEast Asia & PacificEast Asia & Pacific (excluding high income)East Asia & Pacific (IDA & IBRD countries)EcuadorEgypt, Arab Rep.El SalvadorEquatorial GuineaEritreaEstoniaEthiopiaEuro areaEurope & Central AsiaEurope & Central Asia (excluding high income)Europe & Central Asia (IDA & IBRD countries)European UnionFaroe IslandsFijiFinlandFragile and conflict affected situationsFranceFrench PolynesiaGabonGambia, TheGeorgiaGermanyGhanaGreeceGrenadaGuatemalaGuineaGuinea-BissauGuyanaHaitiHeavily indebted poor countries (HIPC)High incomeHondurasHong Kong SAR, ChinaHungaryIBRD onlyIcelandIDA & IBRD totalIDA blendIDA onlyIDA totalIndiaIndonesiaIran, Islamic Rep.IraqIrelandIsraelItalyJamaicaJapanJordanKazakhstanKenyaKiribatiKorea, Rep.KosovoKuwaitKyrgyz RepublicLao PDRLate-demographic dividendLatin America & Caribbean Latin America & Caribbean (excluding high income)Latin America & the Caribbean (IDA & IBRD countries)LatviaLeast developed countries: UN classificationLebanonLesothoLiberiaLibyaLithuaniaLow & middle incomeLow incomeLower middle incomeLuxembourgMacao SAR, ChinaMacedonia, FYRMadagascarMalawiMalaysiaMaldivesMaliMaltaMauritaniaMauritiusMexicoMicronesia, Fed. Sts.Middle East & North AfricaMiddle East & North Africa (excluding high income)Middle East & North Africa (IDA & IBRD countries)Middle incomeMoldovaMongoliaMontenegroMoroccoMozambiqueNamibiaNepalNetherlandsNew CaledoniaNew ZealandNicaraguaNigerNigeriaNorth AmericaNorwayOECD membersOmanOther small statesPakistanPanamaPapua New GuineaParaguayPeruPhilippinesPolandPortugalPost-demographic dividendPre-demographic dividendPuerto RicoQatarRomaniaRussian FederationRwandaSaudi ArabiaSenegalSerbiaSeychellesSierra LeoneSingaporeSlovak RepublicSloveniaSmall statesSolomon IslandsSomaliaSouth AfricaSouth AsiaSouth Asia (IDA & IBRD)South SudanSpainSri LankaSt. Kitts and NevisSt. LuciaSt. Vincent and the GrenadinesSub-Saharan Africa Sub-Saharan Africa (excluding high income)Sub-Saharan Africa (IDA & IBRD countries)SudanSurinameSwazilandSwedenSwitzerlandSyrian Arab RepublicTajikistanTanzaniaThailandTimor-LesteTogoTongaTrinidad and TobagoTunisiaTurkeyTurkmenistanUgandaUkraineUnited Arab EmiratesUnited KingdomUnited StatesUpper middle incomeUruguayUzbekistanVanuatuVenezuela, RBVietnamWest Bank and GazaWorldYemen, Rep.ZambiaZimbabwe La ligne de temps
Cette échelle de temps montre un graphique de 1981 année à 2015 année Vanuatu. Les données jusqu'à 1980 année ne sont pas présentés. Quantité d'observations actuelles selon dates: 35.
Source (désignation):
Les indicateurs du développement mondiale
Source (organisation):
World Bank national accounts data, and OECD National Accounts data files.
Catégories:
Economy & Growth
Dernière mise à jour
23 avr. 2017
Les indicateurs de changement de valeurs selon les années
Minimum:
23.257 mln.
1 janv. 1982
Maximum:
142.105 mln.
1 janv. 2012
Pour la date d''observation
Valeur
Changement absolu
Le changement par rapport à la valeur précédente
1 janv. 1981
30.632 mln.
+30.632 mln.
0.0%
1 janv. 1982
23.257 mln.
-7.374 mln.
-24.07%
1 janv. 1983
24.187 mln.
+929.83 milles
4.0%
1 janv. 1984
36.832 mln.
+12.645 mln.
52.28%
1 janv. 1985
41.288 mln.
+4.456 mln.
12.1%
1 janv. 1986
42.544 mln.
+1.256 mln.
3.04%
1 janv. 1987
44.212 mln.
+1.668 mln.
3.92%
1 janv. 1988
46.801 mln.
+2.589 mln.
5.86%
1 janv. 1989
50.811 mln.
+4.01 mln.
8.57%
1 janv. 1990
43.838 mln.
-6.974 mln.
-13.72%
1 janv. 1991
46.617 mln.
+2.78 mln.
6.34%
1 janv. 1992
49.973 mln.
+3.356 mln.
7.2%
1 janv. 1993
52.296 mln.
+2.323 mln.
4.65%
1 janv. 1994
51.842 mln.
-454.476 milles
-0.87%
1 janv. 1995
58.649 mln.
+6.807 mln.
13.13%
1 janv. 1996
61.689 mln.
+3.04 mln.
5.18%
1 janv. 1997
70.445 mln.
+8.756 mln.
14.19%
1 janv. 1998
53.172 mln.
-17.273 mln.
-24.52%
1 janv. 1999
52.942 mln.
-229.905 milles
-0.43%
1 janv. 2000
57.811 mln.
+4.87 mln.
9.2%
1 janv. 2001
56.574 mln.
-1.238 mln.
-2.14%
1 janv. 2002
52.907 mln.
-3.667 mln.
-6.48%
1 janv. 2003
43.693 mln.
-9.214 mln.
-17.41%
1 janv. 2004
51.33 mln.
+7.637 mln.
17.48%
1 janv. 2005
54.987 mln.
+3.657 mln.
7.12%
1 janv. 2006
57.494 mln.
+2.507 mln.
4.56%
1 janv. 2007
68.682 mln.
+11.188 mln.
19.46%
1 janv. 2008
90.25 mln.
+21.568 mln.
31.4%
1 janv. 2009
98.565 mln.
+8.315 mln.
9.21%
1 janv. 2010
105.396 mln.
+6.831 mln.
6.93%
1 janv. 2011
132.386 mln.
+26.991 mln.
25.61%
1 janv. 2012
142.105 mln.
+9.718 mln.
7.34%
1 janv. 2013
132.236 mln.
-9.869 mln.
-6.94%
1 janv. 2014
130.396 mln.
-1.839 mln.
-1.39%
1 janv. 2015
121.673 mln.
-8.723 mln.
-6.69%
Classement des pays selon les statistiques actuelles par années


Commentaires: