29
/fr/
fr
AIzaSyAYiBZKx7MnpbEhh9jyipgxe19OcubqV5w
April 1, 2024
145682
Guinea
GIN
true
2
1
General government final consumption expenditure (current US$)
2016,2015,2014,2013,2012,2011,2010,2009,2008,2007,2006,2005,2004,2003,2002,2001,2000,1999,1998,1997,1996,1995,1994,1993,1992,1991,1990,1989,1988,1987
Cette statistique dans les autres pays:
AfghanistanAlbaniaAlgeriaAngolaAntigua and BarbudaArab WorldArgentinaArmeniaArubaAustraliaAustriaAzerbaijanBahamas, TheBahrainBangladeshBarbadosBelarusBelgiumBelizeBeninBermudaBhutanBoliviaBosnia and HerzegovinaBotswanaBrazilBrunei DarussalamBulgariaBurkina FasoBurundiCabo VerdeCambodiaCameroonCanadaCaribbean small statesCentral African RepublicCentral Europe and the BalticsChadChileChinaColombiaComorosCongo, Dem. Rep.Congo, Rep.Costa RicaCote d'IvoireCroatiaCubaCyprusCzech RepublicDenmarkDjiboutiDominicaDominican RepublicEarly-demographic dividendEast Asia & PacificEast Asia & Pacific (excluding high income)East Asia & Pacific (IDA & IBRD countries)EcuadorEgypt, Arab Rep.El SalvadorEquatorial GuineaEritreaEstoniaEthiopiaEuro areaEurope & Central AsiaEurope & Central Asia (excluding high income)Europe & Central Asia (IDA & IBRD countries)European UnionFaroe IslandsFijiFinlandFragile and conflict affected situationsFranceFrench PolynesiaGabonGambia, TheGeorgiaGermanyGhanaGreeceGrenadaGuatemalaGuineaGuinea-BissauGuyanaHaitiHeavily indebted poor countries (HIPC)High incomeHondurasHong Kong SAR, ChinaHungaryIBRD onlyIcelandIDA & IBRD totalIDA blendIDA onlyIDA totalIndiaIndonesiaIran, Islamic Rep.IraqIrelandIsraelItalyJamaicaJapanJordanKazakhstanKenyaKiribatiKorea, Rep.KosovoKuwaitKyrgyz RepublicLao PDRLate-demographic dividendLatin America & Caribbean Latin America & Caribbean (excluding high income)Latin America & the Caribbean (IDA & IBRD countries)LatviaLeast developed countries: UN classificationLebanonLesothoLiberiaLibyaLithuaniaLow & middle incomeLow incomeLower middle incomeLuxembourgMacao SAR, ChinaMacedonia, FYRMadagascarMalawiMalaysiaMaldivesMaliMaltaMauritaniaMauritiusMexicoMicronesia, Fed. Sts.Middle East & North AfricaMiddle East & North Africa (excluding high income)Middle East & North Africa (IDA & IBRD countries)Middle incomeMoldovaMongoliaMontenegroMoroccoMozambiqueNamibiaNepalNetherlandsNew CaledoniaNew ZealandNicaraguaNigerNigeriaNorth AmericaNorwayOECD membersOmanOther small statesPakistanPanamaPapua New GuineaParaguayPeruPhilippinesPolandPortugalPost-demographic dividendPre-demographic dividendPuerto RicoQatarRomaniaRussian FederationRwandaSaudi ArabiaSenegalSerbiaSeychellesSierra LeoneSingaporeSlovak RepublicSloveniaSmall statesSolomon IslandsSomaliaSouth AfricaSouth AsiaSouth Asia (IDA & IBRD)South SudanSpainSri LankaSt. Kitts and NevisSt. LuciaSt. Vincent and the GrenadinesSub-Saharan Africa Sub-Saharan Africa (excluding high income)Sub-Saharan Africa (IDA & IBRD countries)SudanSurinameSwazilandSwedenSwitzerlandSyrian Arab RepublicTajikistanTanzaniaThailandTimor-LesteTogoTongaTrinidad and TobagoTunisiaTurkeyTurkmenistanUgandaUkraineUnited Arab EmiratesUnited KingdomUnited StatesUpper middle incomeUruguayUzbekistanVanuatuVenezuela, RBVietnamWest Bank and GazaWorldYemen, Rep.ZambiaZimbabwe La ligne de temps
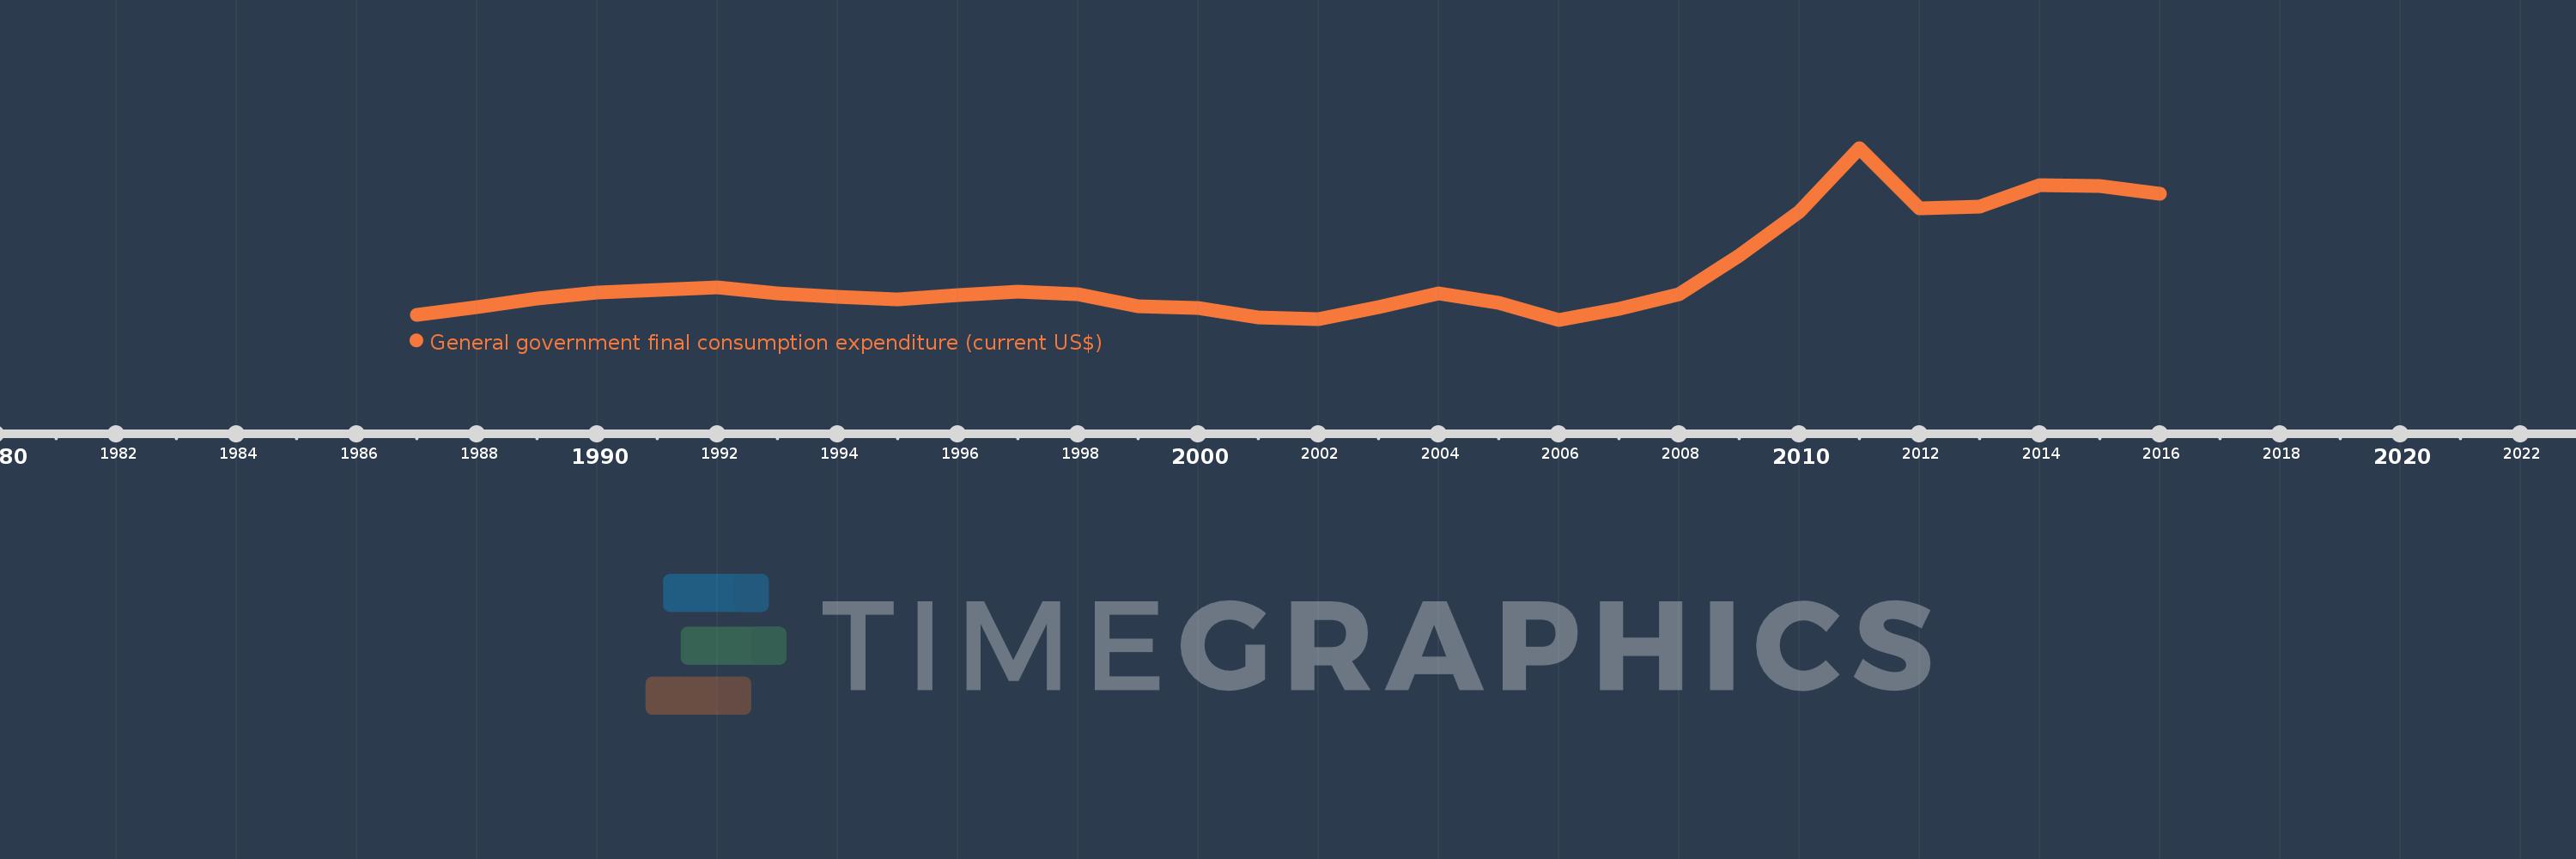
Cette échelle de temps montre un graphique de 1987 année à 2016 année Guinea. Les données jusqu'à 1986 année ne sont pas présentés. Quantité d'observations actuelles selon dates: 30.
Source (désignation):
Les indicateurs du développement mondiale
Source (organisation):
World Bank national accounts data, and OECD National Accounts data files.
Catégories:
Economy & Growth
Dernière mise à jour
23 avr. 2017
Les indicateurs de changement de valeurs selon les années
Minimum:
205.236 mln.
1 janv. 2006
Maximum:
711.886 mln.
1 janv. 2011
Pour la date d''observation
Valeur
Changement absolu
Le changement par rapport à la valeur précédente
1 janv. 1987
219.983 mln.
+219.983 mln.
0.0%
1 janv. 1988
243.414 mln.
+23.431 mln.
10.65%
1 janv. 1989
266.587 mln.
+23.173 mln.
9.52%
1 janv. 1990
284.294 mln.
+17.707 mln.
6.64%
1 janv. 1991
292.104 mln.
+7.81 mln.
2.75%
1 janv. 1992
300.003 mln.
+7.899 mln.
2.7%
1 janv. 1993
283.792 mln.
-16.211 mln.
-5.4%
1 janv. 1994
273.312 mln.
-10.48 mln.
-3.69%
1 janv. 1995
265.875 mln.
-7.438 mln.
-2.72%
1 janv. 1996
277.672 mln.
+11.797 mln.
4.44%
1 janv. 1997
289.121 mln.
+11.449 mln.
4.12%
1 janv. 1998
279.492 mln.
-9.629 mln.
-3.33%
1 janv. 1999
244.217 mln.
-35.275 mln.
-12.62%
1 janv. 2000
240.831 mln.
-3.386 mln.
-1.39%
1 janv. 2001
212.197 mln.
-28.634 mln.
-11.89%
1 janv. 2002
208.225 mln.
-3.972 mln.
-1.87%
1 janv. 2003
241.623 mln.
+33.399 mln.
16.04%
1 janv. 2004
281.899 mln.
+40.276 mln.
16.67%
1 janv. 2005
254.76 mln.
-27.138 mln.
-9.63%
1 janv. 2006
205.236 mln.
-49.524 mln.
-19.44%
1 janv. 2007
237.838 mln.
+32.602 mln.
15.88%
1 janv. 2008
279.653 mln.
+41.815 mln.
17.58%
1 janv. 2009
394.615 mln.
+114.962 mln.
41.11%
1 janv. 2010
522.486 mln.
+127.87 mln.
32.4%
1 janv. 2011
711.886 mln.
+189.4 mln.
36.25%
1 janv. 2012
534.785 mln.
-177.101 mln.
-24.88%
1 janv. 2013
539.306 mln.
+4.521 mln.
0.85%
1 janv. 2014
602.993 mln.
+63.687 mln.
11.81%
1 janv. 2015
600.118 mln.
-2.875 mln.
-0.48%
1 janv. 2016
575.912 mln.
-24.206 mln.
-4.03%
Classement des pays selon les statistiques actuelles par années


Commentaires: