29
/fr/
fr
AIzaSyAYiBZKx7MnpbEhh9jyipgxe19OcubqV5w
April 1, 2024
135539
Gabon
GAB
true
2
1
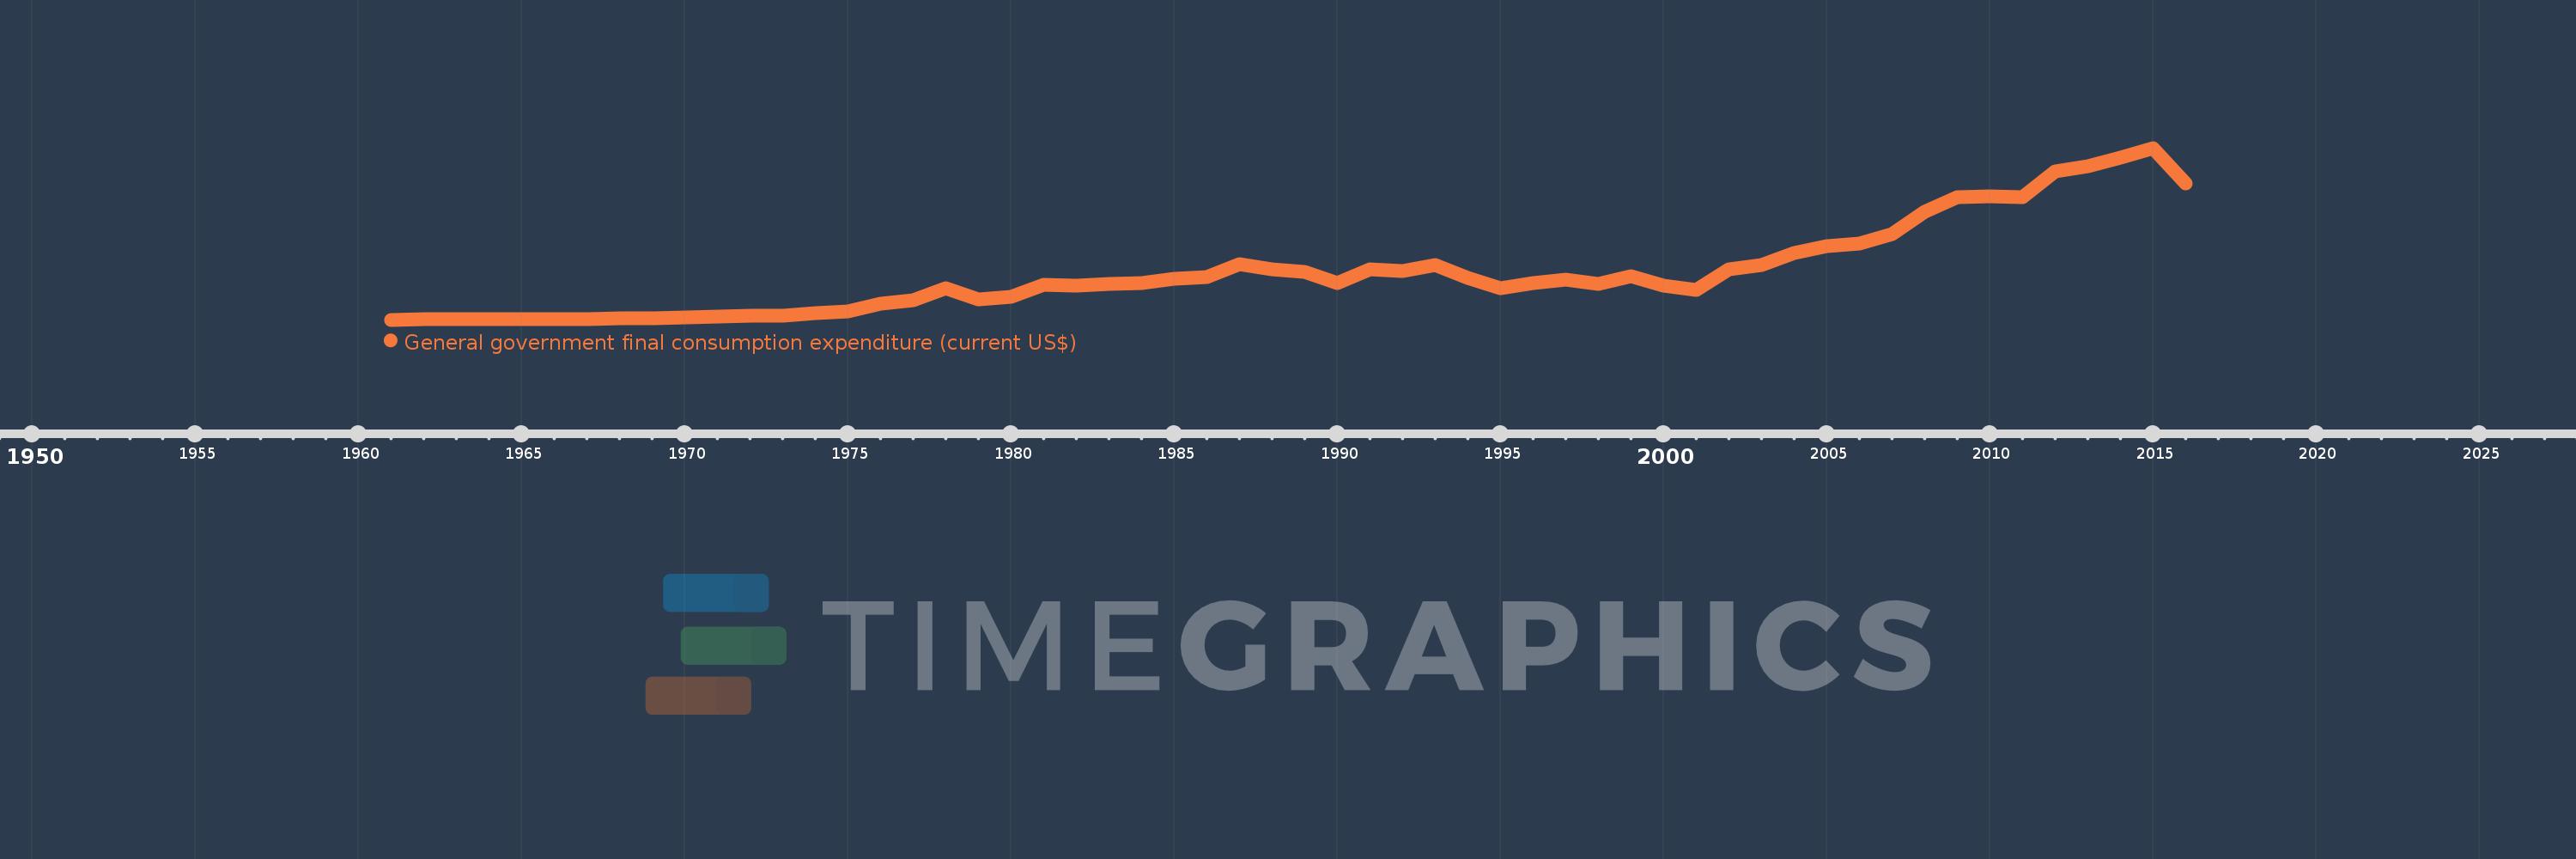
General government final consumption expenditure (current US$)
2016,2015,2014,2013,2012,2011,2010,2009,2008,2007,2006,2005,2004,2003,2002,2001,2000,1999,1998,1997,1996,1995,1994,1993,1992,1991,1990,1989,1988,1987,1986,1985,1984,1983,1982,1981,1980,1979,1978,1977,1976,1975,1974,1973,1972,1971,1970,1969,1968,1967,1966,1965,1964,1963,1962,1961
Cette statistique dans les autres pays:
AfghanistanAlbaniaAlgeriaAngolaAntigua and BarbudaArab WorldArgentinaArmeniaArubaAustraliaAustriaAzerbaijanBahamas, TheBahrainBangladeshBarbadosBelarusBelgiumBelizeBeninBermudaBhutanBoliviaBosnia and HerzegovinaBotswanaBrazilBrunei DarussalamBulgariaBurkina FasoBurundiCabo VerdeCambodiaCameroonCanadaCaribbean small statesCentral African RepublicCentral Europe and the BalticsChadChileChinaColombiaComorosCongo, Dem. Rep.Congo, Rep.Costa RicaCote d'IvoireCroatiaCubaCyprusCzech RepublicDenmarkDjiboutiDominicaDominican RepublicEarly-demographic dividendEast Asia & PacificEast Asia & Pacific (excluding high income)East Asia & Pacific (IDA & IBRD countries)EcuadorEgypt, Arab Rep.El SalvadorEquatorial GuineaEritreaEstoniaEthiopiaEuro areaEurope & Central AsiaEurope & Central Asia (excluding high income)Europe & Central Asia (IDA & IBRD countries)European UnionFaroe IslandsFijiFinlandFragile and conflict affected situationsFranceFrench PolynesiaGabonGambia, TheGeorgiaGermanyGhanaGreeceGrenadaGuatemalaGuineaGuinea-BissauGuyanaHaitiHeavily indebted poor countries (HIPC)High incomeHondurasHong Kong SAR, ChinaHungaryIBRD onlyIcelandIDA & IBRD totalIDA blendIDA onlyIDA totalIndiaIndonesiaIran, Islamic Rep.IraqIrelandIsraelItalyJamaicaJapanJordanKazakhstanKenyaKiribatiKorea, Rep.KosovoKuwaitKyrgyz RepublicLao PDRLate-demographic dividendLatin America & Caribbean Latin America & Caribbean (excluding high income)Latin America & the Caribbean (IDA & IBRD countries)LatviaLeast developed countries: UN classificationLebanonLesothoLiberiaLibyaLithuaniaLow & middle incomeLow incomeLower middle incomeLuxembourgMacao SAR, ChinaMacedonia, FYRMadagascarMalawiMalaysiaMaldivesMaliMaltaMauritaniaMauritiusMexicoMicronesia, Fed. Sts.Middle East & North AfricaMiddle East & North Africa (excluding high income)Middle East & North Africa (IDA & IBRD countries)Middle incomeMoldovaMongoliaMontenegroMoroccoMozambiqueNamibiaNepalNetherlandsNew CaledoniaNew ZealandNicaraguaNigerNigeriaNorth AmericaNorwayOECD membersOmanOther small statesPakistanPanamaPapua New GuineaParaguayPeruPhilippinesPolandPortugalPost-demographic dividendPre-demographic dividendPuerto RicoQatarRomaniaRussian FederationRwandaSaudi ArabiaSenegalSerbiaSeychellesSierra LeoneSingaporeSlovak RepublicSloveniaSmall statesSolomon IslandsSomaliaSouth AfricaSouth AsiaSouth Asia (IDA & IBRD)South SudanSpainSri LankaSt. Kitts and NevisSt. LuciaSt. Vincent and the GrenadinesSub-Saharan Africa Sub-Saharan Africa (excluding high income)Sub-Saharan Africa (IDA & IBRD countries)SudanSurinameSwazilandSwedenSwitzerlandSyrian Arab RepublicTajikistanTanzaniaThailandTimor-LesteTogoTongaTrinidad and TobagoTunisiaTurkeyTurkmenistanUgandaUkraineUnited Arab EmiratesUnited KingdomUnited StatesUpper middle incomeUruguayUzbekistanVanuatuVenezuela, RBVietnamWest Bank and GazaWorldYemen, Rep.ZambiaZimbabwe La ligne de temps
Cette échelle de temps montre un graphique de 1961 année à 2016 année Gabon. Les données jusqu'à 1960 année ne sont pas présentés. Quantité d'observations actuelles selon dates: 56.
Source (désignation):
Les indicateurs du développement mondiale
Source (organisation):
World Bank national accounts data, and OECD National Accounts data files.
Catégories:
Economy & Growth
Dernière mise à jour
23 avr. 2017
Les indicateurs de changement de valeurs selon les années
Minimum:
13.835 mln.
1 janv. 1961
Maximum:
2.7 mds
1 janv. 2015
Pour la date d''observation
Valeur
Changement absolu
Le changement par rapport à la valeur précédente
1 janv. 1961
13.835 mln.
+13.835 mln.
0.0%
1 janv. 1962
17.219 mln.
+3.384 mln.
24.46%
1 janv. 1963
18.649 mln.
+1.43 mln.
8.31%
1 janv. 1964
21.757 mln.
+3.108 mln.
16.67%
1 janv. 1965
24.864 mln.
+3.107 mln.
14.28%
1 janv. 1966
25.708 mln.
+844.089 milles
3.39%
1 janv. 1967
29.307 mln.
+3.599 mln.
14.0%
1 janv. 1968
36.992 mln.
+7.685 mln.
26.22%
1 janv. 1969
41.201 mln.
+4.21 mln.
11.38%
1 janv. 1970
44.622 mln.
+3.421 mln.
8.3%
1 janv. 1971
63.675 mln.
+19.053 mln.
42.7%
1 janv. 1972
71.544 mln.
+7.869 mln.
12.36%
1 janv. 1973
76.182 mln.
+4.638 mln.
6.48%
1 janv. 1974
112.612 mln.
+36.43 mln.
47.82%
1 janv. 1975
142.914 mln.
+30.302 mln.
26.91%
1 janv. 1976
263.633 mln.
+120.72 mln.
84.47%
1 janv. 1977
318.058 mln.
+54.424 mln.
20.64%
1 janv. 1978
508.386 mln.
+190.328 mln.
59.84%
1 janv. 1979
327.047 mln.
-181.339 mln.
-35.67%
1 janv. 1980
366.206 mln.
+39.159 mln.
11.97%
1 janv. 1981
566.075 mln.
+199.869 mln.
54.58%
1 janv. 1982
550.176 mln.
-15.899 mln.
-2.81%
1 janv. 1983
568.461 mln.
+18.286 mln.
3.32%
1 janv. 1984
583.363 mln.
+14.902 mln.
2.62%
1 janv. 1985
650.865 mln.
+67.502 mln.
11.57%
1 janv. 1986
681.783 mln.
+30.918 mln.
4.75%
1 janv. 1987
877.548 mln.
+195.765 mln.
28.71%
1 janv. 1988
805.892 mln.
-71.656 mln.
-8.17%
1 janv. 1989
758.776 mln.
-47.116 mln.
-5.85%
1 janv. 1990
593.401 mln.
-165.374 mln.
-21.79%
1 janv. 1991
797.753 mln.
+204.351 mln.
34.44%
1 janv. 1992
771.009 mln.
-26.744 mln.
-3.35%
1 janv. 1993
866.559 mln.
+95.55 mln.
12.39%
1 janv. 1994
670.034 mln.
-196.525 mln.
-22.68%
1 janv. 1995
502.38 mln.
-167.654 mln.
-25.02%
1 janv. 1996
582.992 mln.
+80.611 mln.
16.05%
1 janv. 1997
640.089 mln.
+57.097 mln.
9.79%
1 janv. 1998
575.326 mln.
-64.763 mln.
-10.12%
1 janv. 1999
693.446 mln.
+118.121 mln.
20.53%
1 janv. 2000
549.294 mln.
-144.152 mln.
-20.79%
1 janv. 2001
484.492 mln.
-64.802 mln.
-11.8%
1 janv. 2002
802.928 mln.
+318.436 mln.
65.73%
1 janv. 2003
874.309 mln.
+71.381 mln.
8.89%
1 janv. 2004
1.053 mds
+178.258 mln.
20.39%
1 janv. 2005
1.164 mds
+111.432 mln.
10.59%
1 janv. 2006
1.201 mds
+36.756 mln.
3.16%
1 janv. 2007
1.359 mds
+158.139 mln.
13.17%
1 janv. 2008
1.701 mds
+342.025 mln.
25.17%
1 janv. 2009
1.928 mds
+226.872 mln.
13.34%
1 janv. 2010
1.945 mds
+17.547 mln.
0.91%
1 janv. 2011
1.937 mds
-8.804 mln.
-0.45%
1 janv. 2012
2.327 mds
+390.192 mln.
20.15%
1 janv. 2013
2.409 mds
+82.566 mln.
3.55%
1 janv. 2014
2.543 mds
+133.664 mln.
5.55%
1 janv. 2015
2.7 mds
+156.64 mln.
6.16%
1 janv. 2016
2.144 mds
-555.736 mln.
-20.59%
Classement des pays selon les statistiques actuelles par années


Commentaires: