29
/fr/
fr
AIzaSyAYiBZKx7MnpbEhh9jyipgxe19OcubqV5w
April 1, 2024
210383
Nicaragua
NIC
true
2
1
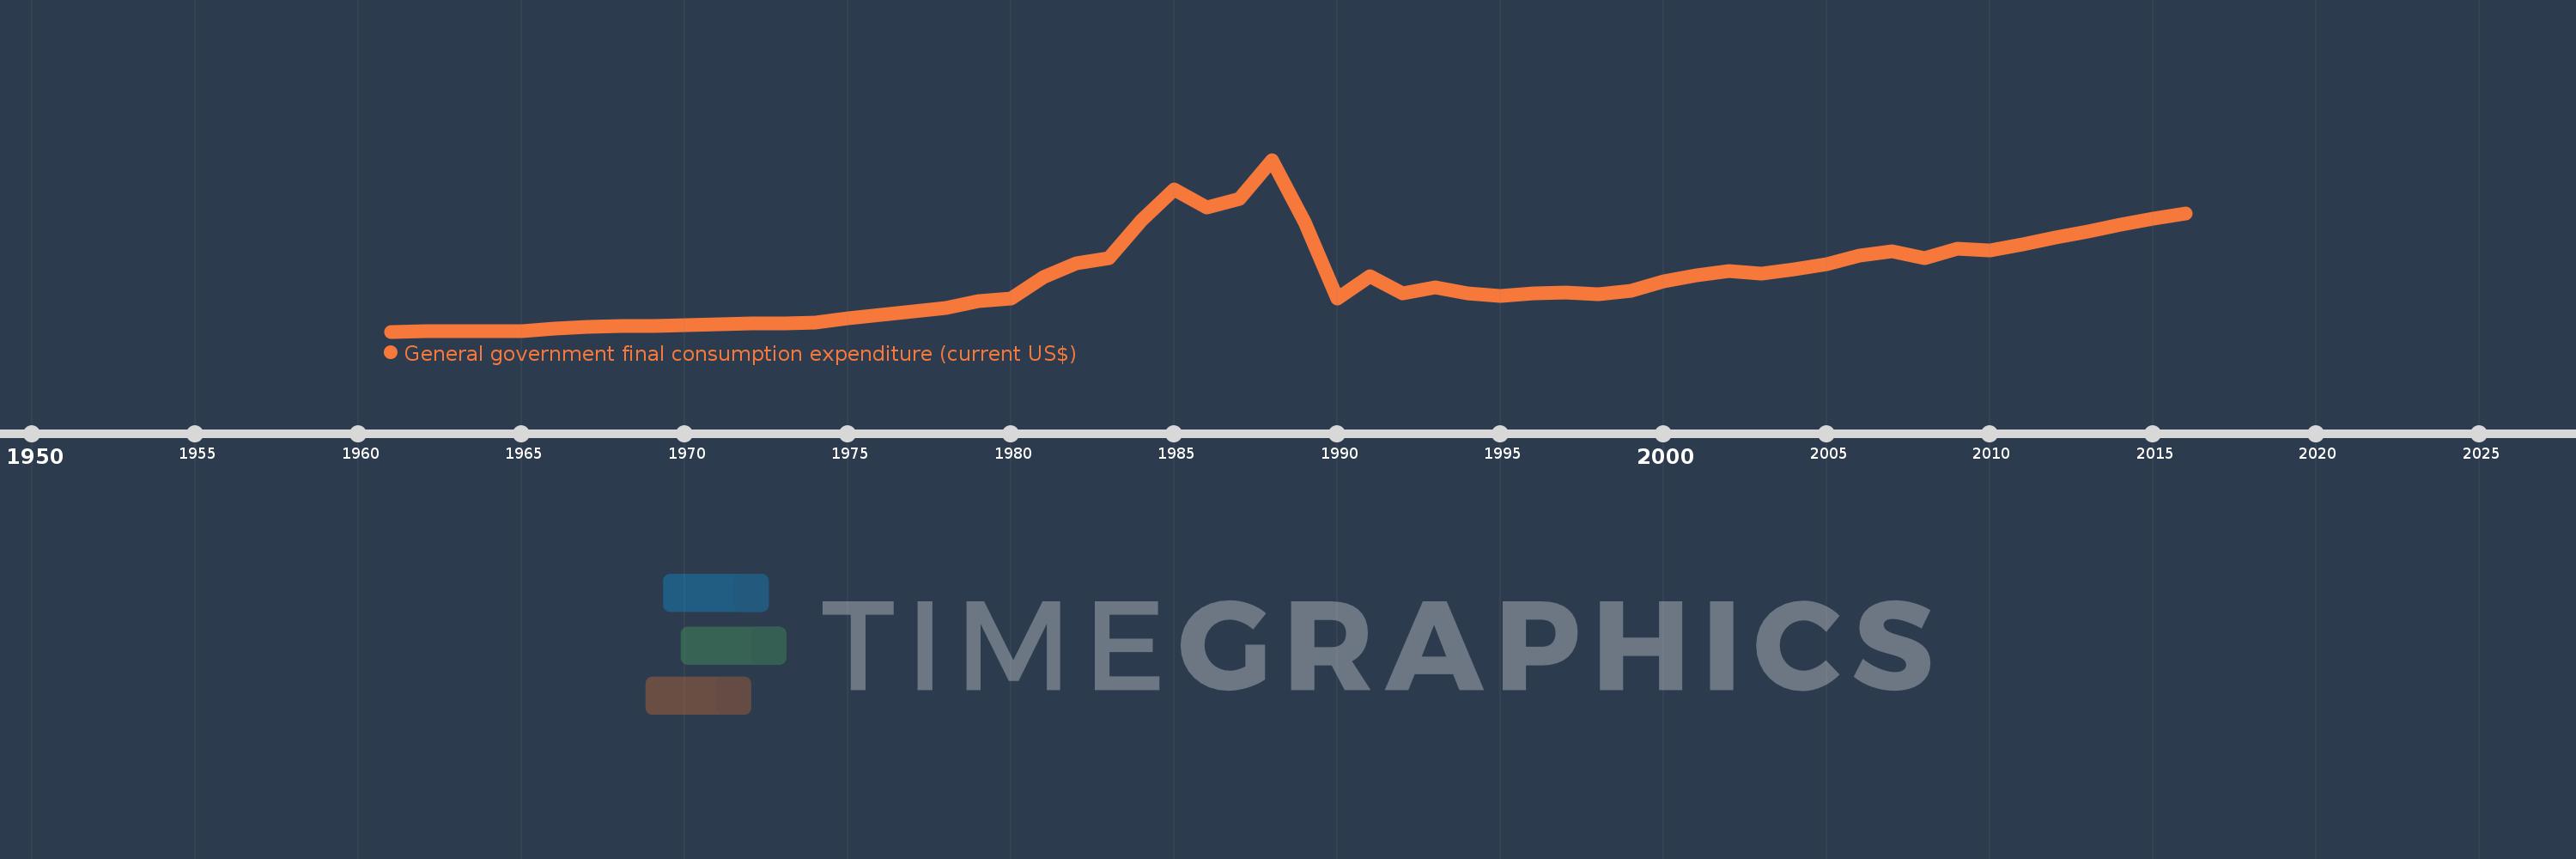
General government final consumption expenditure (current US$)
2016,2015,2014,2013,2012,2011,2010,2009,2008,2007,2006,2005,2004,2003,2002,2001,2000,1999,1998,1997,1996,1995,1994,1993,1992,1991,1990,1989,1988,1987,1986,1985,1984,1983,1982,1981,1980,1979,1978,1977,1976,1975,1974,1973,1972,1971,1970,1969,1968,1967,1966,1965,1964,1963,1962,1961
Cette statistique dans les autres pays:
AfghanistanAlbaniaAlgeriaAngolaAntigua and BarbudaArab WorldArgentinaArmeniaArubaAustraliaAustriaAzerbaijanBahamas, TheBahrainBangladeshBarbadosBelarusBelgiumBelizeBeninBermudaBhutanBoliviaBosnia and HerzegovinaBotswanaBrazilBrunei DarussalamBulgariaBurkina FasoBurundiCabo VerdeCambodiaCameroonCanadaCaribbean small statesCentral African RepublicCentral Europe and the BalticsChadChileChinaColombiaComorosCongo, Dem. Rep.Congo, Rep.Costa RicaCote d'IvoireCroatiaCubaCyprusCzech RepublicDenmarkDjiboutiDominicaDominican RepublicEarly-demographic dividendEast Asia & PacificEast Asia & Pacific (excluding high income)East Asia & Pacific (IDA & IBRD countries)EcuadorEgypt, Arab Rep.El SalvadorEquatorial GuineaEritreaEstoniaEthiopiaEuro areaEurope & Central AsiaEurope & Central Asia (excluding high income)Europe & Central Asia (IDA & IBRD countries)European UnionFaroe IslandsFijiFinlandFragile and conflict affected situationsFranceFrench PolynesiaGabonGambia, TheGeorgiaGermanyGhanaGreeceGrenadaGuatemalaGuineaGuinea-BissauGuyanaHaitiHeavily indebted poor countries (HIPC)High incomeHondurasHong Kong SAR, ChinaHungaryIBRD onlyIcelandIDA & IBRD totalIDA blendIDA onlyIDA totalIndiaIndonesiaIran, Islamic Rep.IraqIrelandIsraelItalyJamaicaJapanJordanKazakhstanKenyaKiribatiKorea, Rep.KosovoKuwaitKyrgyz RepublicLao PDRLate-demographic dividendLatin America & Caribbean Latin America & Caribbean (excluding high income)Latin America & the Caribbean (IDA & IBRD countries)LatviaLeast developed countries: UN classificationLebanonLesothoLiberiaLibyaLithuaniaLow & middle incomeLow incomeLower middle incomeLuxembourgMacao SAR, ChinaMacedonia, FYRMadagascarMalawiMalaysiaMaldivesMaliMaltaMauritaniaMauritiusMexicoMicronesia, Fed. Sts.Middle East & North AfricaMiddle East & North Africa (excluding high income)Middle East & North Africa (IDA & IBRD countries)Middle incomeMoldovaMongoliaMontenegroMoroccoMozambiqueNamibiaNepalNetherlandsNew CaledoniaNew ZealandNicaraguaNigerNigeriaNorth AmericaNorwayOECD membersOmanOther small statesPakistanPanamaPapua New GuineaParaguayPeruPhilippinesPolandPortugalPost-demographic dividendPre-demographic dividendPuerto RicoQatarRomaniaRussian FederationRwandaSaudi ArabiaSenegalSerbiaSeychellesSierra LeoneSingaporeSlovak RepublicSloveniaSmall statesSolomon IslandsSomaliaSouth AfricaSouth AsiaSouth Asia (IDA & IBRD)South SudanSpainSri LankaSt. Kitts and NevisSt. LuciaSt. Vincent and the GrenadinesSub-Saharan Africa Sub-Saharan Africa (excluding high income)Sub-Saharan Africa (IDA & IBRD countries)SudanSurinameSwazilandSwedenSwitzerlandSyrian Arab RepublicTajikistanTanzaniaThailandTimor-LesteTogoTongaTrinidad and TobagoTunisiaTurkeyTurkmenistanUgandaUkraineUnited Arab EmiratesUnited KingdomUnited StatesUpper middle incomeUruguayUzbekistanVanuatuVenezuela, RBVietnamWest Bank and GazaWorldYemen, Rep.ZambiaZimbabwe La ligne de temps
Cette échelle de temps montre un graphique de 1961 année à 2016 année Nicaragua. Les données jusqu'à 1960 année ne sont pas présentés. Quantité d'observations actuelles selon dates: 56.
Source (désignation):
Les indicateurs du développement mondiale
Source (organisation):
World Bank national accounts data, and OECD National Accounts data files.
Catégories:
Economy & Growth
Dernière mise à jour
23 avr. 2017
Les indicateurs de changement de valeurs selon les années
Minimum:
19.623 mln.
1 janv. 1961
Maximum:
1.318 mds
1 janv. 1988
Pour la date d''observation
Valeur
Changement absolu
Le changement par rapport à la valeur précédente
1 janv. 1961
19.623 mln.
+19.623 mln.
0.0%
1 janv. 1962
20.58 mln.
+957.224 milles
4.88%
1 janv. 1963
22.016 mln.
+1.436 mln.
6.98%
1 janv. 1964
21.537 mln.
-478.604 milles
-2.17%
1 janv. 1965
24.409 mln.
+2.872 mln.
13.33%
1 janv. 1966
45.229 mln.
+20.82 mln.
85.29%
1 janv. 1967
52.457 mln.
+7.229 mln.
15.98%
1 janv. 1968
61.286 mln.
+8.829 mln.
16.83%
1 janv. 1969
62.714 mln.
+1.429 mln.
2.33%
1 janv. 1970
65.329 mln.
+2.614 mln.
4.17%
1 janv. 1971
74.486 mln.
+9.157 mln.
14.02%
1 janv. 1972
80.429 mln.
+5.943 mln.
7.98%
1 janv. 1973
82.743 mln.
+2.314 mln.
2.88%
1 janv. 1974
88.971 mln.
+6.229 mln.
7.53%
1 janv. 1975
117.357 mln.
+28.386 mln.
31.9%
1 janv. 1976
143.9 mln.
+26.543 mln.
22.62%
1 janv. 1977
172.557 mln.
+28.657 mln.
19.91%
1 janv. 1978
199.471 mln.
+26.914 mln.
15.6%
1 janv. 1979
251.771 mln.
+52.3 mln.
26.22%
1 janv. 1980
272.726 mln.
+20.955 mln.
8.32%
1 janv. 1981
431.905 mln.
+159.179 mln.
58.37%
1 janv. 1982
537.11 mln.
+105.205 mln.
24.36%
1 janv. 1983
577.913 mln.
+40.803 mln.
7.6%
1 janv. 1984
862.617 mln.
+284.704 mln.
49.26%
1 janv. 1985
1.097 mds
+234.832 mln.
27.22%
1 janv. 1986
958.946 mln.
-138.502 mln.
-12.62%
1 janv. 1987
1.02 mds
+61.183 mln.
6.38%
1 janv. 1988
1.318 mds
+298.259 mln.
29.24%
1 janv. 1989
847.372 mln.
-471.016 mln.
-35.73%
1 janv. 1990
270.489 mln.
-576.883 mln.
-68.08%
1 janv. 1991
438.903 mln.
+168.414 mln.
62.26%
1 janv. 1992
305.959 mln.
-132.944 mln.
-30.29%
1 janv. 1993
352.68 mln.
+46.721 mln.
15.27%
1 janv. 1994
308.938 mln.
-43.742 mln.
-12.4%
1 janv. 1995
289.39 mln.
-19.548 mln.
-6.33%
1 janv. 1996
311.222 mln.
+21.832 mln.
7.54%
1 janv. 1997
316.452 mln.
+5.23 mln.
1.68%
1 janv. 1998
303.577 mln.
-12.875 mln.
-4.07%
1 janv. 1999
330.323 mln.
+26.746 mln.
8.81%
1 janv. 2000
399.519 mln.
+69.196 mln.
20.95%
1 janv. 2001
443.148 mln.
+43.629 mln.
10.92%
1 janv. 2002
477.093 mln.
+33.944 mln.
7.66%
1 janv. 2003
456.859 mln.
-20.234 mln.
-4.24%
1 janv. 2004
488.851 mln.
+31.993 mln.
7.0%
1 janv. 2005
526.477 mln.
+37.626 mln.
7.7%
1 janv. 2006
595.985 mln.
+69.508 mln.
13.2%
1 janv. 2007
629.762 mln.
+33.776 mln.
5.67%
1 janv. 2008
573.062 mln.
-56.699 mln.
-9.0%
1 janv. 2009
647.225 mln.
+74.163 mln.
12.94%
1 janv. 2010
631.036 mln.
-16.189 mln.
-2.5%
1 janv. 2011
681.178 mln.
+50.142 mln.
7.95%
1 janv. 2012
728.272 mln.
+47.094 mln.
6.91%
1 janv. 2013
775.576 mln.
+47.305 mln.
6.5%
1 janv. 2014
826.928 mln.
+51.352 mln.
6.62%
1 janv. 2015
874.458 mln.
+47.529 mln.
5.75%
1 janv. 2016
913.777 mln.
+39.319 mln.
4.5%
Classement des pays selon les statistiques actuelles par années


Commentaires: