29
/fr/
fr
AIzaSyAYiBZKx7MnpbEhh9jyipgxe19OcubqV5w
April 1, 2024
272255
Uganda
UGA
true
2
1
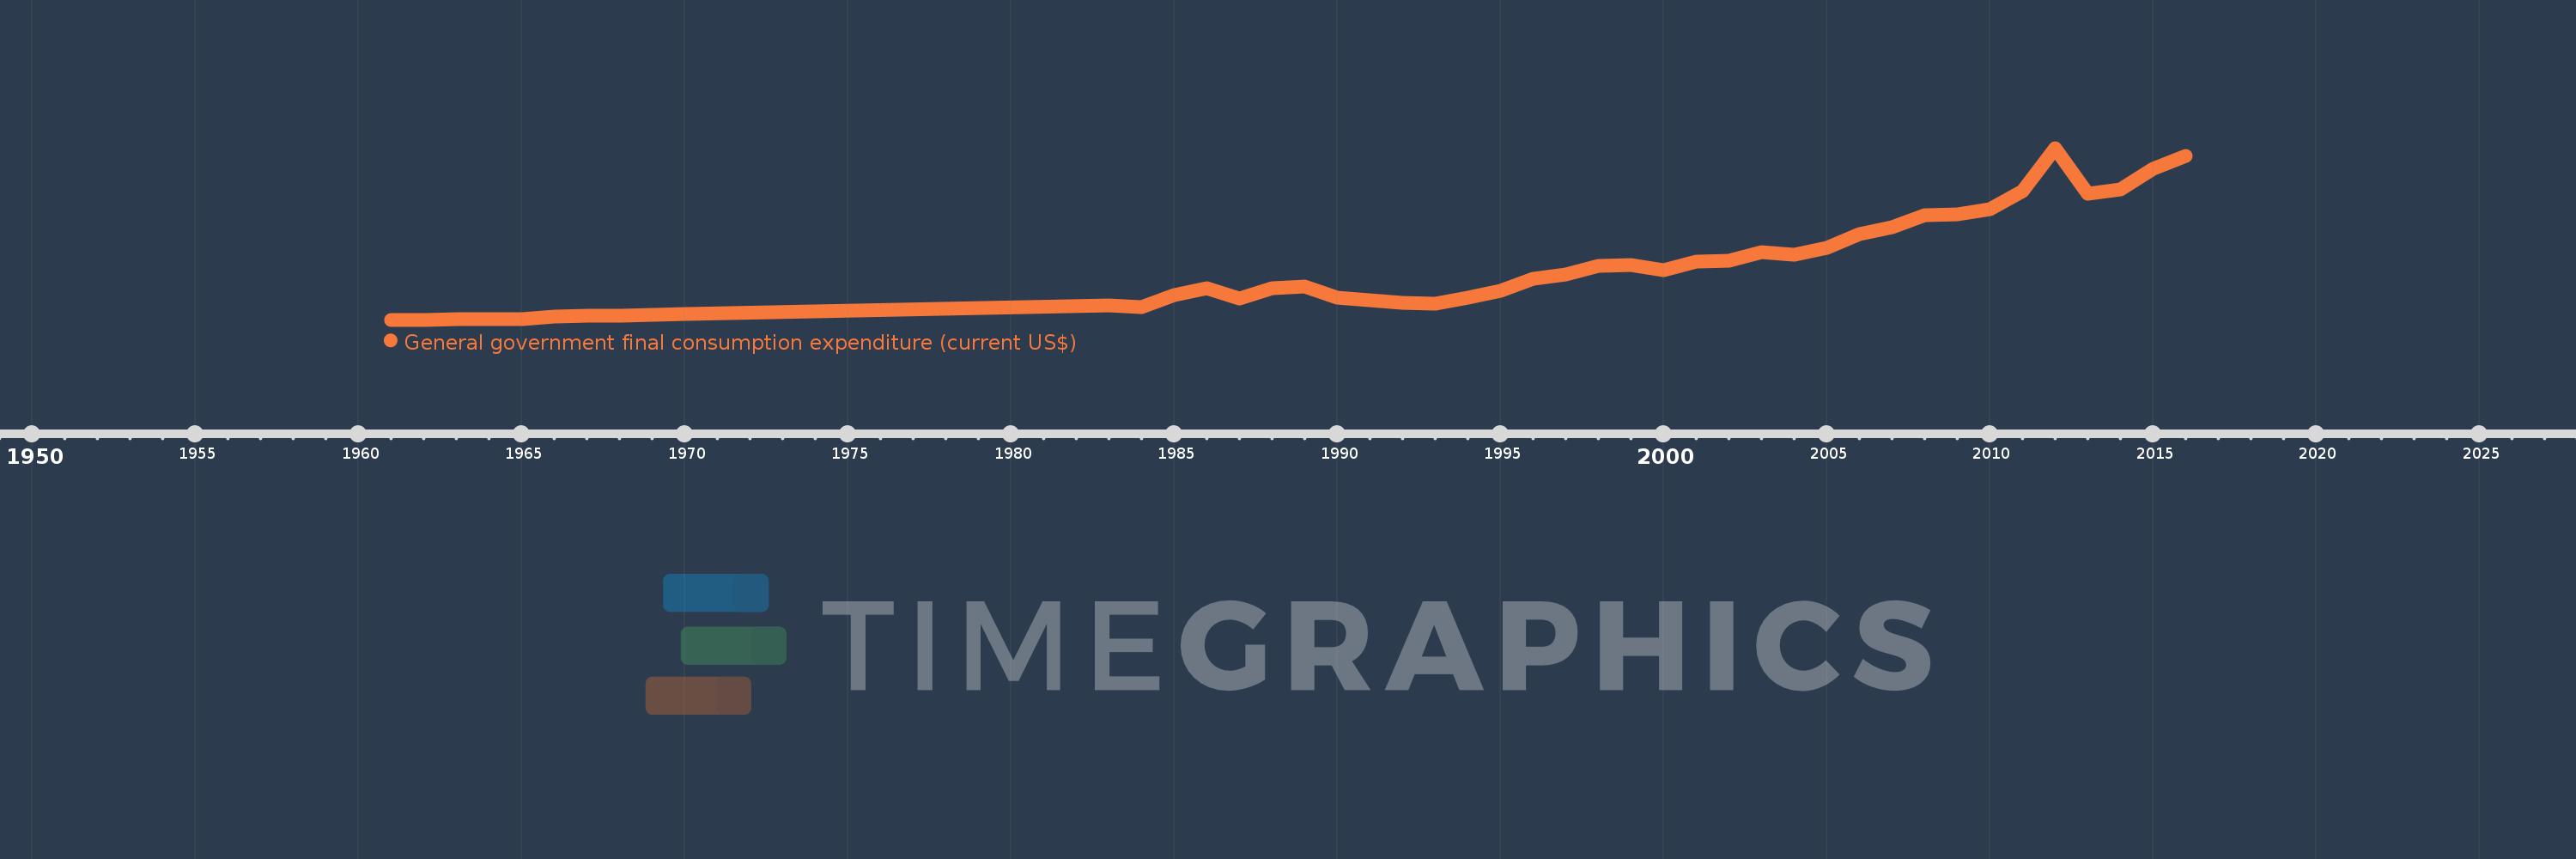
General government final consumption expenditure (current US$)
2016,2015,2014,2013,2012,2011,2010,2009,2008,2007,2006,2005,2004,2003,2002,2001,2000,1999,1998,1997,1996,1995,1994,1993,1992,1991,1990,1989,1988,1987,1986,1985,1984,1983,1970,1969,1968,1967,1966,1965,1964,1963,1962,1961
Cette statistique dans les autres pays:
AfghanistanAlbaniaAlgeriaAngolaAntigua and BarbudaArab WorldArgentinaArmeniaArubaAustraliaAustriaAzerbaijanBahamas, TheBahrainBangladeshBarbadosBelarusBelgiumBelizeBeninBermudaBhutanBoliviaBosnia and HerzegovinaBotswanaBrazilBrunei DarussalamBulgariaBurkina FasoBurundiCabo VerdeCambodiaCameroonCanadaCaribbean small statesCentral African RepublicCentral Europe and the BalticsChadChileChinaColombiaComorosCongo, Dem. Rep.Congo, Rep.Costa RicaCote d'IvoireCroatiaCubaCyprusCzech RepublicDenmarkDjiboutiDominicaDominican RepublicEarly-demographic dividendEast Asia & PacificEast Asia & Pacific (excluding high income)East Asia & Pacific (IDA & IBRD countries)EcuadorEgypt, Arab Rep.El SalvadorEquatorial GuineaEritreaEstoniaEthiopiaEuro areaEurope & Central AsiaEurope & Central Asia (excluding high income)Europe & Central Asia (IDA & IBRD countries)European UnionFaroe IslandsFijiFinlandFragile and conflict affected situationsFranceFrench PolynesiaGabonGambia, TheGeorgiaGermanyGhanaGreeceGrenadaGuatemalaGuineaGuinea-BissauGuyanaHaitiHeavily indebted poor countries (HIPC)High incomeHondurasHong Kong SAR, ChinaHungaryIBRD onlyIcelandIDA & IBRD totalIDA blendIDA onlyIDA totalIndiaIndonesiaIran, Islamic Rep.IraqIrelandIsraelItalyJamaicaJapanJordanKazakhstanKenyaKiribatiKorea, Rep.KosovoKuwaitKyrgyz RepublicLao PDRLate-demographic dividendLatin America & Caribbean Latin America & Caribbean (excluding high income)Latin America & the Caribbean (IDA & IBRD countries)LatviaLeast developed countries: UN classificationLebanonLesothoLiberiaLibyaLithuaniaLow & middle incomeLow incomeLower middle incomeLuxembourgMacao SAR, ChinaMacedonia, FYRMadagascarMalawiMalaysiaMaldivesMaliMaltaMauritaniaMauritiusMexicoMicronesia, Fed. Sts.Middle East & North AfricaMiddle East & North Africa (excluding high income)Middle East & North Africa (IDA & IBRD countries)Middle incomeMoldovaMongoliaMontenegroMoroccoMozambiqueNamibiaNepalNetherlandsNew CaledoniaNew ZealandNicaraguaNigerNigeriaNorth AmericaNorwayOECD membersOmanOther small statesPakistanPanamaPapua New GuineaParaguayPeruPhilippinesPolandPortugalPost-demographic dividendPre-demographic dividendPuerto RicoQatarRomaniaRussian FederationRwandaSaudi ArabiaSenegalSerbiaSeychellesSierra LeoneSingaporeSlovak RepublicSloveniaSmall statesSolomon IslandsSomaliaSouth AfricaSouth AsiaSouth Asia (IDA & IBRD)South SudanSpainSri LankaSt. Kitts and NevisSt. LuciaSt. Vincent and the GrenadinesSub-Saharan Africa Sub-Saharan Africa (excluding high income)Sub-Saharan Africa (IDA & IBRD countries)SudanSurinameSwazilandSwedenSwitzerlandSyrian Arab RepublicTajikistanTanzaniaThailandTimor-LesteTogoTongaTrinidad and TobagoTunisiaTurkeyTurkmenistanUgandaUkraineUnited Arab EmiratesUnited KingdomUnited StatesUpper middle incomeUruguayUzbekistanVanuatuVenezuela, RBVietnamWest Bank and GazaWorldYemen, Rep.ZambiaZimbabwe La ligne de temps
Cette échelle de temps montre un graphique de 1961 année à 2016 année Uganda. Les données jusqu'à 1960 année ne sont pas présentés. Quantité d'observations actuelles selon dates: 44.
Source (désignation):
Les indicateurs du développement mondiale
Source (organisation):
World Bank national accounts data, and OECD National Accounts data files.
Catégories:
Economy & Growth
Dernière mise à jour
23 avr. 2017
Les indicateurs de changement de valeurs selon les années
Minimum:
37.41 mln.
1 janv. 1961
Maximum:
2.58 mds
1 janv. 2012
Pour la date d''observation
Valeur
Changement absolu
Le changement par rapport à la valeur précédente
1 janv. 1961
37.41 mln.
+37.41 mln.
0.0%
1 janv. 1962
37.41 mln.
0.0
0.0%
1 janv. 1963
42.528 mln.
+5.118 mln.
13.68%
1 janv. 1964
44.891 mln.
+2.363 mln.
5.56%
1 janv. 1965
50.799 mln.
+5.908 mln.
13.16%
1 janv. 1966
87.255 mln.
+36.456 mln.
71.77%
1 janv. 1967
93.277 mln.
+6.022 mln.
6.9%
1 janv. 1968
103.361 mln.
+10.084 mln.
10.81%
1 janv. 1969
111.625 mln.
+8.263 mln.
7.99%
1 janv. 1970
124.65 mln.
+13.025 mln.
11.67%
1 janv. 1983
243.5 mln.
+118.85 mln.
95.35%
1 janv. 1984
228.667 mln.
-14.833 mln.
-6.09%
1 janv. 1985
396.863 mln.
+168.196 mln.
73.56%
1 janv. 1986
510.13 mln.
+113.267 mln.
28.54%
1 janv. 1987
353.596 mln.
-156.534 mln.
-30.69%
1 janv. 1988
499.11 mln.
+145.515 mln.
41.15%
1 janv. 1989
527.567 mln.
+28.456 mln.
5.7%
1 janv. 1990
367.857 mln.
-159.71 mln.
-30.27%
1 janv. 1991
323.305 mln.
-44.552 mln.
-12.11%
1 janv. 1992
293.623 mln.
-29.683 mln.
-9.18%
1 janv. 1993
275.962 mln.
-17.661 mln.
-6.01%
1 janv. 1994
359.097 mln.
+83.135 mln.
30.13%
1 janv. 1995
468.684 mln.
+109.586 mln.
30.52%
1 janv. 1996
643.402 mln.
+174.719 mln.
37.28%
1 janv. 1997
710.658 mln.
+67.256 mln.
10.45%
1 janv. 1998
833.243 mln.
+122.585 mln.
17.25%
1 janv. 1999
847.265 mln.
+14.022 mln.
1.68%
1 janv. 2000
771.671 mln.
-75.594 mln.
-8.92%
1 janv. 2001
898.289 mln.
+126.618 mln.
16.41%
1 janv. 2002
910.058 mln.
+11.77 mln.
1.31%
1 janv. 2003
1.038 mds
+127.475 mln.
14.01%
1 janv. 2004
997.716 mln.
-39.817 mln.
-3.84%
1 janv. 2005
1.103 mds
+104.986 mln.
10.52%
1 janv. 2006
1.306 mds
+203.652 mln.
18.47%
1 janv. 2007
1.402 mds
+95.782 mln.
7.33%
1 janv. 2008
1.585 mds
+182.781 mln.
13.04%
1 janv. 2009
1.596 mds
+11.404 mln.
0.72%
1 janv. 2010
1.676 mds
+79.786 mln.
5.0%
1 janv. 2011
1.937 mds
+260.627 mln.
15.55%
1 janv. 2012
2.58 mds
+643.364 mln.
33.22%
1 janv. 2013
1.9 mds
-679.733 mln.
-26.35%
1 janv. 2014
1.966 mds
+65.437 mln.
3.44%
1 janv. 2015
2.27 mds
+304.16 mln.
15.47%
1 janv. 2016
2.456 mds
+185.82 mln.
8.19%
Classement des pays selon les statistiques actuelles par années


Commentaires: