29
/fr/
fr
AIzaSyAYiBZKx7MnpbEhh9jyipgxe19OcubqV5w
April 1, 2024
264677
Togo
TGO
true
2
1
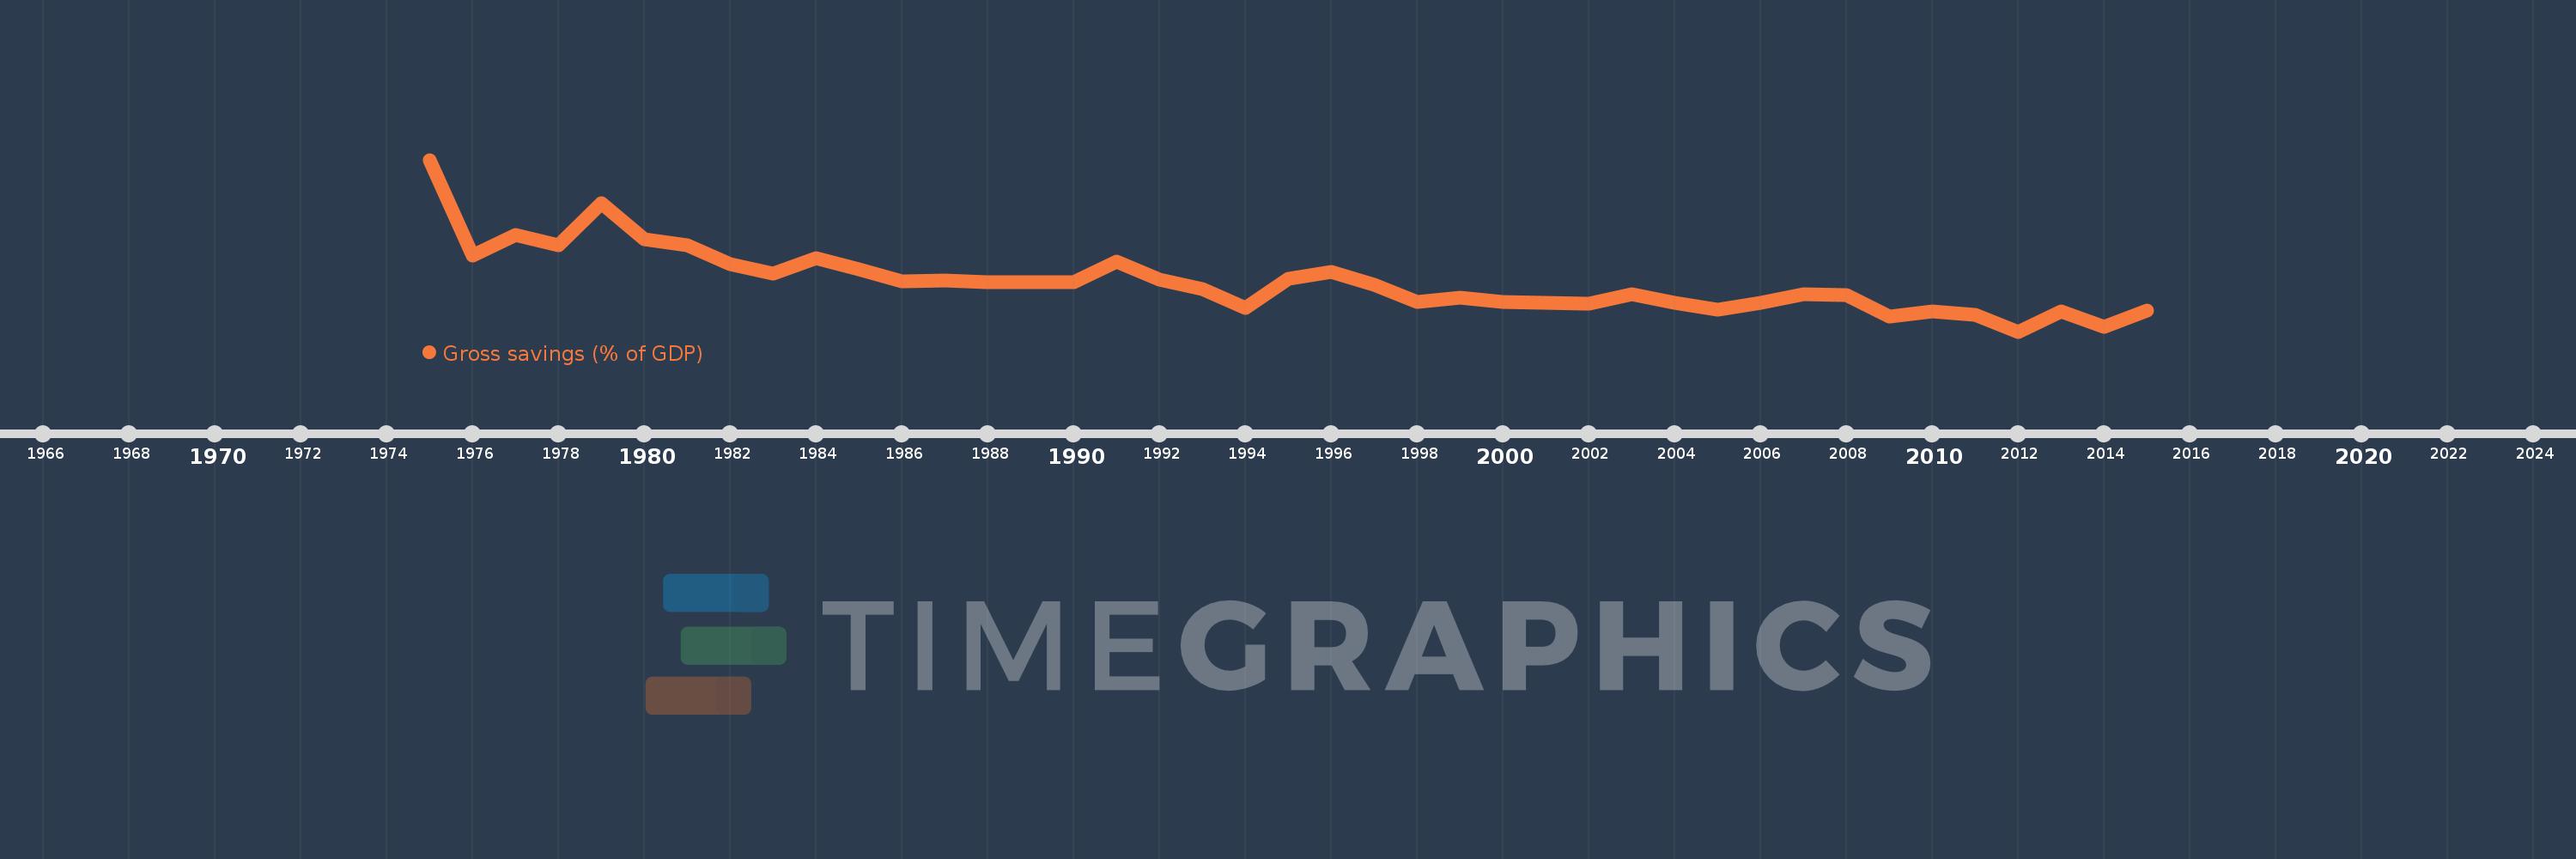
Gross savings (% of GDP)
2015,2014,2013,2012,2011,2010,2009,2008,2007,2006,2005,2004,2003,2002,2001,2000,1999,1998,1997,1996,1995,1994,1993,1992,1991,1990,1989,1988,1987,1986,1985,1984,1983,1982,1981,1980,1979,1978,1977,1976,1975
Cette statistique dans les autres pays:
AfghanistanAlbaniaAlgeriaAngolaAntigua and BarbudaArab WorldArgentinaArmeniaAustraliaAustriaAzerbaijanBahamas, TheBahrainBangladeshBarbadosBelarusBelgiumBelizeBeninBermudaBhutanBoliviaBosnia and HerzegovinaBotswanaBrazilBrunei DarussalamBulgariaBurkina FasoBurundiCabo VerdeCambodiaCameroonCanadaCaribbean small statesCentral African RepublicCentral Europe and the BalticsChadChileChinaColombiaComorosCongo, Dem. Rep.Congo, Rep.Costa RicaCote d'IvoireCroatiaCyprusCzech RepublicDenmarkDjiboutiDominicaDominican RepublicEarly-demographic dividendEast Asia & PacificEast Asia & Pacific (excluding high income)East Asia & Pacific (IDA & IBRD countries)EcuadorEgypt, Arab Rep.El SalvadorEquatorial GuineaEritreaEstoniaEthiopiaEuro areaEurope & Central AsiaEurope & Central Asia (excluding high income)Europe & Central Asia (IDA & IBRD countries)European UnionFaroe IslandsFijiFinlandFragile and conflict affected situationsFranceGabonGambia, TheGeorgiaGermanyGhanaGreeceGrenadaGuatemalaGuineaGuinea-BissauGuyanaHaitiHeavily indebted poor countries (HIPC)High incomeHondurasHong Kong SAR, ChinaHungaryIBRD onlyIcelandIDA & IBRD totalIDA blendIDA onlyIDA totalIndiaIndonesiaIran, Islamic Rep.IraqIrelandIsraelItalyJamaicaJapanJordanKazakhstanKenyaKiribatiKorea, Rep.KosovoKuwaitKyrgyz RepublicLao PDRLate-demographic dividendLatin America & Caribbean Latin America & Caribbean (excluding high income)Latin America & the Caribbean (IDA & IBRD countries)LatviaLeast developed countries: UN classificationLebanonLesothoLiberiaLibyaLithuaniaLow & middle incomeLow incomeLower middle incomeLuxembourgMacao SAR, ChinaMacedonia, FYRMadagascarMalawiMalaysiaMaldivesMaliMaltaMauritaniaMauritiusMexicoMiddle East & North AfricaMiddle East & North Africa (excluding high income)Middle East & North Africa (IDA & IBRD countries)Middle incomeMoldovaMongoliaMontenegroMoroccoMozambiqueNamibiaNepalNetherlandsNew ZealandNicaraguaNigerNigeriaNorth AmericaNorwayOECD membersOmanOther small statesPacific island small statesPakistanPanamaPapua New GuineaParaguayPeruPhilippinesPolandPortugalPost-demographic dividendPre-demographic dividendQatarRomaniaRussian FederationRwandaSaudi ArabiaSenegalSerbiaSeychellesSierra LeoneSingaporeSlovak RepublicSloveniaSmall statesSolomon IslandsSouth AfricaSouth AsiaSouth Asia (IDA & IBRD)South SudanSpainSri LankaSt. Kitts and NevisSt. LuciaSt. Vincent and the GrenadinesSub-Saharan Africa Sub-Saharan Africa (excluding high income)Sub-Saharan Africa (IDA & IBRD countries)SudanSurinameSwazilandSwedenSwitzerlandSyrian Arab RepublicTajikistanTanzaniaThailandTimor-LesteTogoTongaTrinidad and TobagoTunisiaTurkeyUgandaUkraineUnited KingdomUnited StatesUpper middle incomeUruguayVanuatuVenezuela, RBVietnamWest Bank and GazaWorldYemen, Rep.ZambiaZimbabwe La ligne de temps
Cette échelle de temps montre un graphique de 1975 année à 2015 année Togo. Les données jusqu'à 1974 année ne sont pas présentés. Quantité d'observations actuelles selon dates: 41.
Source (désignation):
Les indicateurs du développement mondiale
Source (organisation):
World Bank national accounts data, and OECD National Accounts data files.
Catégories:
Economy & Growth
Dernière mise à jour
23 avr. 2017
Les indicateurs de changement de valeurs selon les années
Minimum:
-6.303
1 janv. 2012
Maximum:
60.374
1 janv. 1975
Pour la date d''observation
Valeur
Changement absolu
Le changement par rapport à la valeur précédente
1 janv. 1975
60.374
+60.374
0.0%
1 janv. 1976
23.258
-37.116
-61.48%
1 janv. 1977
31.045
+7.787
33.48%
1 janv. 1978
27.06
-3.985
-12.84%
1 janv. 1979
43.398
+16.339
60.38%
1 janv. 1980
29.444
-13.954
-32.15%
1 janv. 1981
27.229
-2.215
-7.52%
1 janv. 1982
19.8
-7.429
-27.28%
1 janv. 1983
16.14
-3.66
-18.48%
1 janv. 1984
22.179
+6.039
37.41%
1 janv. 1985
17.726
-4.453
-20.08%
1 janv. 1986
13.206
-4.52
-25.5%
1 janv. 1987
13.528
+0.322
2.44%
1 janv. 1988
12.702
-0.826
-6.1%
1 janv. 1989
12.766
+0.063
0.5%
1 janv. 1990
12.942
+0.177
1.38%
1 janv. 1991
20.952
+8.009
61.88%
1 janv. 1992
14.004
-6.948
-33.16%
1 janv. 1993
10.205
-3.799
-27.13%
1 janv. 1994
2.762
-7.443
-72.93%
1 janv. 1995
14.251
+11.489
415.92%
1 janv. 1996
16.742
+2.491
17.48%
1 janv. 1997
11.9
-4.842
-28.92%
1 janv. 1998
5.158
-6.742
-56.66%
1 janv. 1999
6.995
+1.837
35.62%
1 janv. 2000
5.282
-1.713
-24.49%
1 janv. 2001
4.969
-0.313
-5.93%
1 janv. 2002
4.521
-0.448
-9.01%
1 janv. 2003
8.273
+3.752
83.0%
1 janv. 2004
4.907
-3.366
-40.69%
1 janv. 2005
2.222
-2.685
-54.72%
1 janv. 2006
4.892
+2.67
120.16%
1 janv. 2007
8.204
+3.312
67.7%
1 janv. 2008
7.927
-0.277
-3.37%
1 janv. 2009
-0.555
-8.483
-107.01%
1 janv. 2010
1.623
+2.178
-392.2%
1 janv. 2011
0.034
-1.589
-97.93%
1 janv. 2012
-6.303
-6.337
-18.9 milles%
1 janv. 2013
1.507
+7.81
-123.9%
1 janv. 2014
-4.366
-5.872
-389.79%
1 janv. 2015
1.806
+6.172
-141.37%
Classement des pays selon les statistiques actuelles par années


Commentaires: