29
/fr/
fr
AIzaSyAYiBZKx7MnpbEhh9jyipgxe19OcubqV5w
April 1, 2024
140461
Ghana
GHA
true
2
1
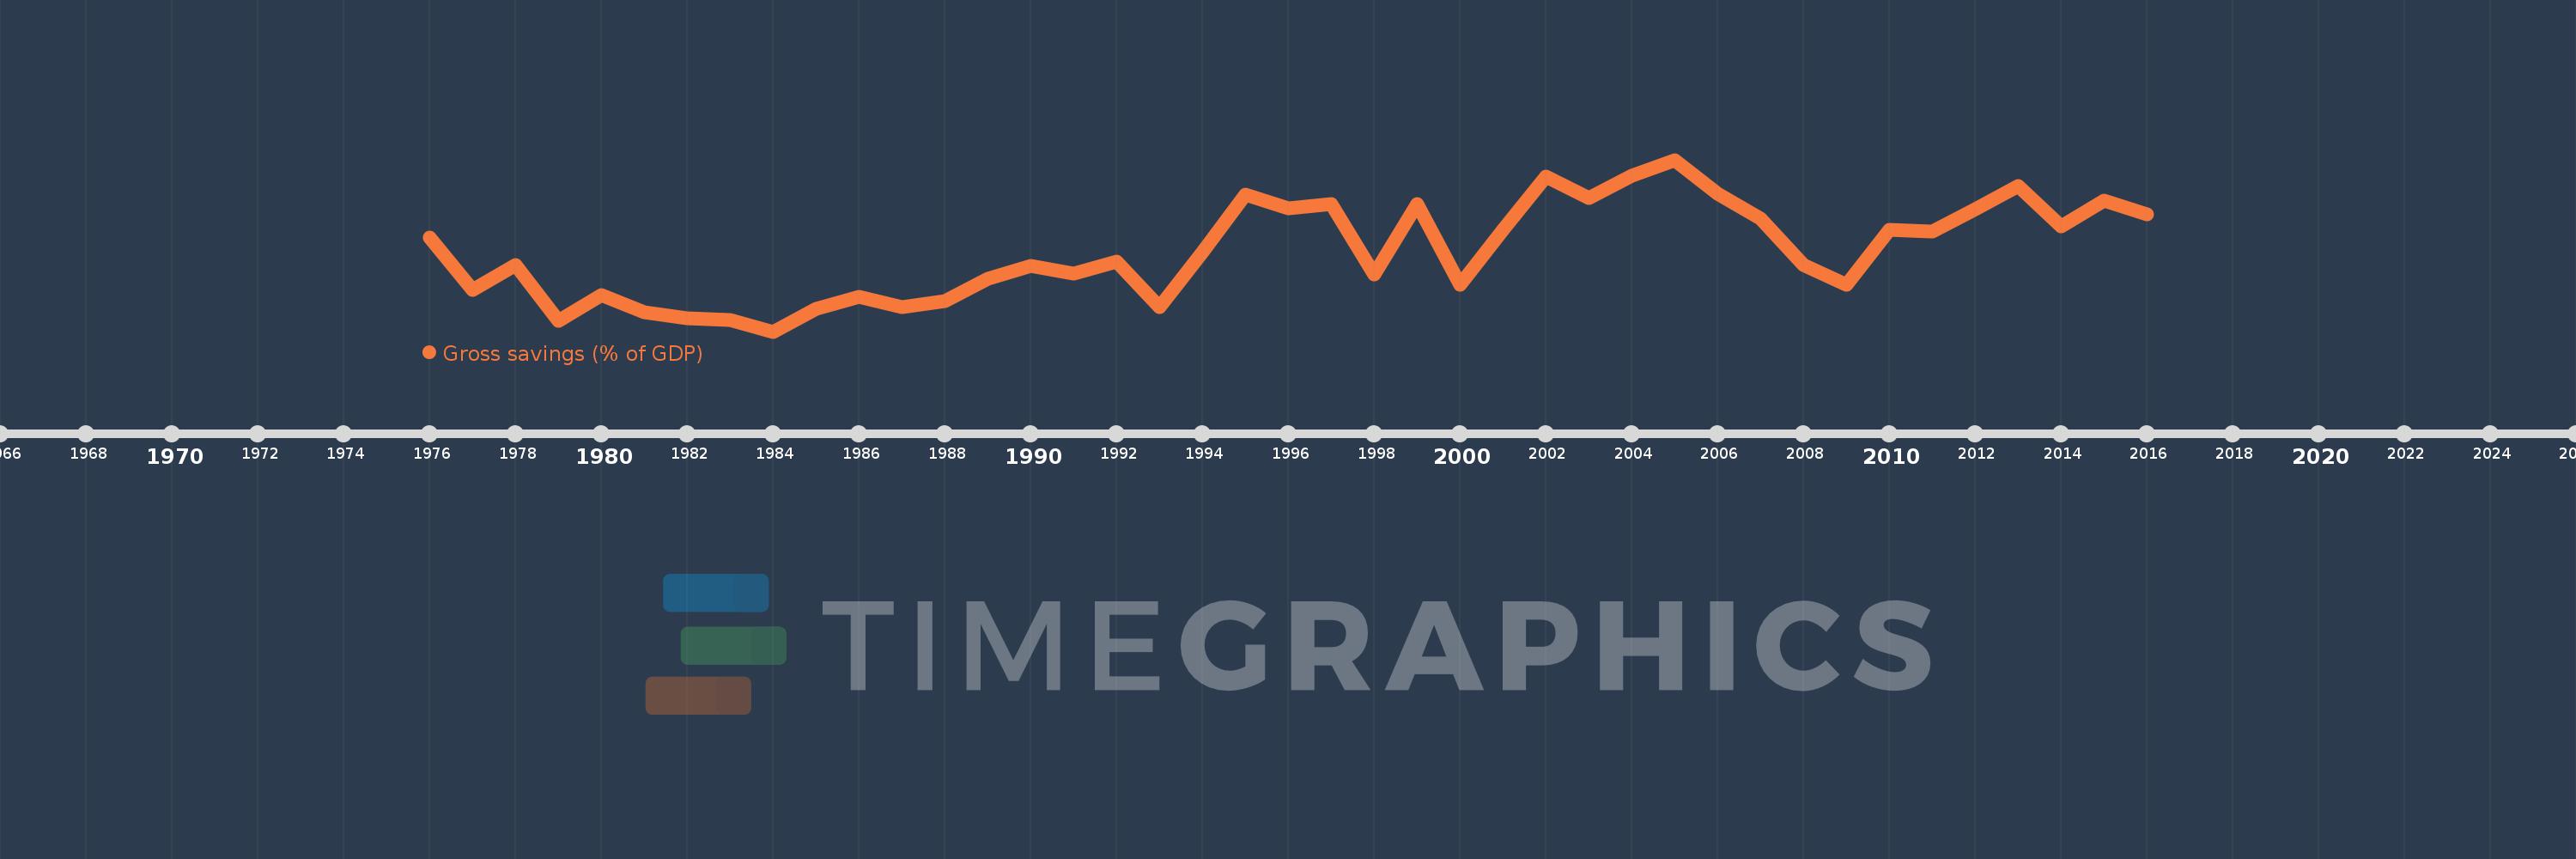
Gross savings (% of GDP)
2016,2015,2014,2013,2012,2011,2010,2009,2008,2007,2006,2005,2004,2003,2002,2001,2000,1999,1998,1997,1996,1995,1994,1993,1992,1991,1990,1989,1988,1987,1986,1985,1984,1983,1982,1981,1980,1979,1978,1977,1976
Cette statistique dans les autres pays:
AfghanistanAlbaniaAlgeriaAngolaAntigua and BarbudaArab WorldArgentinaArmeniaAustraliaAustriaAzerbaijanBahamas, TheBahrainBangladeshBarbadosBelarusBelgiumBelizeBeninBermudaBhutanBoliviaBosnia and HerzegovinaBotswanaBrazilBrunei DarussalamBulgariaBurkina FasoBurundiCabo VerdeCambodiaCameroonCanadaCaribbean small statesCentral African RepublicCentral Europe and the BalticsChadChileChinaColombiaComorosCongo, Dem. Rep.Congo, Rep.Costa RicaCote d'IvoireCroatiaCyprusCzech RepublicDenmarkDjiboutiDominicaDominican RepublicEarly-demographic dividendEast Asia & PacificEast Asia & Pacific (excluding high income)East Asia & Pacific (IDA & IBRD countries)EcuadorEgypt, Arab Rep.El SalvadorEquatorial GuineaEritreaEstoniaEthiopiaEuro areaEurope & Central AsiaEurope & Central Asia (excluding high income)Europe & Central Asia (IDA & IBRD countries)European UnionFaroe IslandsFijiFinlandFragile and conflict affected situationsFranceGabonGambia, TheGeorgiaGermanyGhanaGreeceGrenadaGuatemalaGuineaGuinea-BissauGuyanaHaitiHeavily indebted poor countries (HIPC)High incomeHondurasHong Kong SAR, ChinaHungaryIBRD onlyIcelandIDA & IBRD totalIDA blendIDA onlyIDA totalIndiaIndonesiaIran, Islamic Rep.IraqIrelandIsraelItalyJamaicaJapanJordanKazakhstanKenyaKiribatiKorea, Rep.KosovoKuwaitKyrgyz RepublicLao PDRLate-demographic dividendLatin America & Caribbean Latin America & Caribbean (excluding high income)Latin America & the Caribbean (IDA & IBRD countries)LatviaLeast developed countries: UN classificationLebanonLesothoLiberiaLibyaLithuaniaLow & middle incomeLow incomeLower middle incomeLuxembourgMacao SAR, ChinaMacedonia, FYRMadagascarMalawiMalaysiaMaldivesMaliMaltaMauritaniaMauritiusMexicoMiddle East & North AfricaMiddle East & North Africa (excluding high income)Middle East & North Africa (IDA & IBRD countries)Middle incomeMoldovaMongoliaMontenegroMoroccoMozambiqueNamibiaNepalNetherlandsNew ZealandNicaraguaNigerNigeriaNorth AmericaNorwayOECD membersOmanOther small statesPacific island small statesPakistanPanamaPapua New GuineaParaguayPeruPhilippinesPolandPortugalPost-demographic dividendPre-demographic dividendQatarRomaniaRussian FederationRwandaSaudi ArabiaSenegalSerbiaSeychellesSierra LeoneSingaporeSlovak RepublicSloveniaSmall statesSolomon IslandsSouth AfricaSouth AsiaSouth Asia (IDA & IBRD)South SudanSpainSri LankaSt. Kitts and NevisSt. LuciaSt. Vincent and the GrenadinesSub-Saharan Africa Sub-Saharan Africa (excluding high income)Sub-Saharan Africa (IDA & IBRD countries)SudanSurinameSwazilandSwedenSwitzerlandSyrian Arab RepublicTajikistanTanzaniaThailandTimor-LesteTogoTongaTrinidad and TobagoTunisiaTurkeyUgandaUkraineUnited KingdomUnited StatesUpper middle incomeUruguayVanuatuVenezuela, RBVietnamWest Bank and GazaWorldYemen, Rep.ZambiaZimbabwe La ligne de temps
Cette échelle de temps montre un graphique de 1976 année à 2016 année Ghana. Les données jusqu'à 1975 année ne sont pas présentés. Quantité d'observations actuelles selon dates: 41.
Source (désignation):
Les indicateurs du développement mondiale
Source (organisation):
World Bank national accounts data, and OECD National Accounts data files.
Catégories:
Economy & Growth
Dernière mise à jour
23 avr. 2017
Les indicateurs de changement de valeurs selon les années
Minimum:
4.257
1 janv. 1984
Maximum:
22.872
1 janv. 2005
Pour la date d''observation
Valeur
Changement absolu
Le changement par rapport à la valeur précédente
1 janv. 1976
14.437
+14.437
0.0%
1 janv. 1977
8.783
-5.653
-39.16%
1 janv. 1978
11.492
+2.708
30.83%
1 janv. 1979
5.408
-6.083
-52.94%
1 janv. 1980
8.255
+2.847
52.64%
1 janv. 1981
6.324
-1.931
-23.39%
1 janv. 1982
5.703
-0.621
-9.81%
1 janv. 1983
5.555
-0.148
-2.6%
1 janv. 1984
4.257
-1.298
-23.37%
1 janv. 1985
6.746
+2.489
58.47%
1 janv. 1986
8.034
+1.289
19.11%
1 janv. 1987
6.934
-1.101
-13.7%
1 janv. 1988
7.571
+0.637
9.19%
1 janv. 1989
9.964
+2.393
31.61%
1 janv. 1990
11.405
+1.441
14.47%
1 janv. 1991
10.533
-0.872
-7.65%
1 janv. 1992
11.869
+1.336
12.68%
1 janv. 1993
6.935
-4.934
-41.57%
1 janv. 1994
12.84
+5.905
85.15%
1 janv. 1995
19.08
+6.24
48.6%
1 janv. 1996
17.625
-1.455
-7.63%
1 janv. 1997
18.093
+0.469
2.66%
1 janv. 1998
10.411
-7.682
-42.46%
1 janv. 1999
18.033
+7.622
73.21%
1 janv. 2000
9.362
-8.671
-48.08%
1 janv. 2001
15.265
+5.904
63.06%
1 janv. 2002
21.093
+5.827
38.17%
1 janv. 2003
18.754
-2.339
-11.09%
1 janv. 2004
21.157
+2.403
12.81%
1 janv. 2005
22.872
+1.715
8.11%
1 janv. 2006
19.227
-3.644
-15.93%
1 janv. 2007
16.49
-2.737
-14.24%
1 janv. 2008
11.49
-5.0
-30.32%
1 janv. 2009
9.343
-2.147
-18.69%
1 janv. 2010
15.297
+5.954
63.73%
1 janv. 2011
15.131
-0.166
-1.09%
1 janv. 2012
17.474
+2.343
15.48%
1 janv. 2013
19.992
+2.518
14.41%
1 janv. 2014
15.688
-4.304
-21.53%
1 janv. 2015
18.489
+2.801
17.85%
1 janv. 2016
16.985
-1.504
-8.13%
Classement des pays selon les statistiques actuelles par années


Commentaires: