29
/fr/
fr
AIzaSyAYiBZKx7MnpbEhh9jyipgxe19OcubqV5w
April 1, 2024
231118
Rwanda
RWA
true
2
1
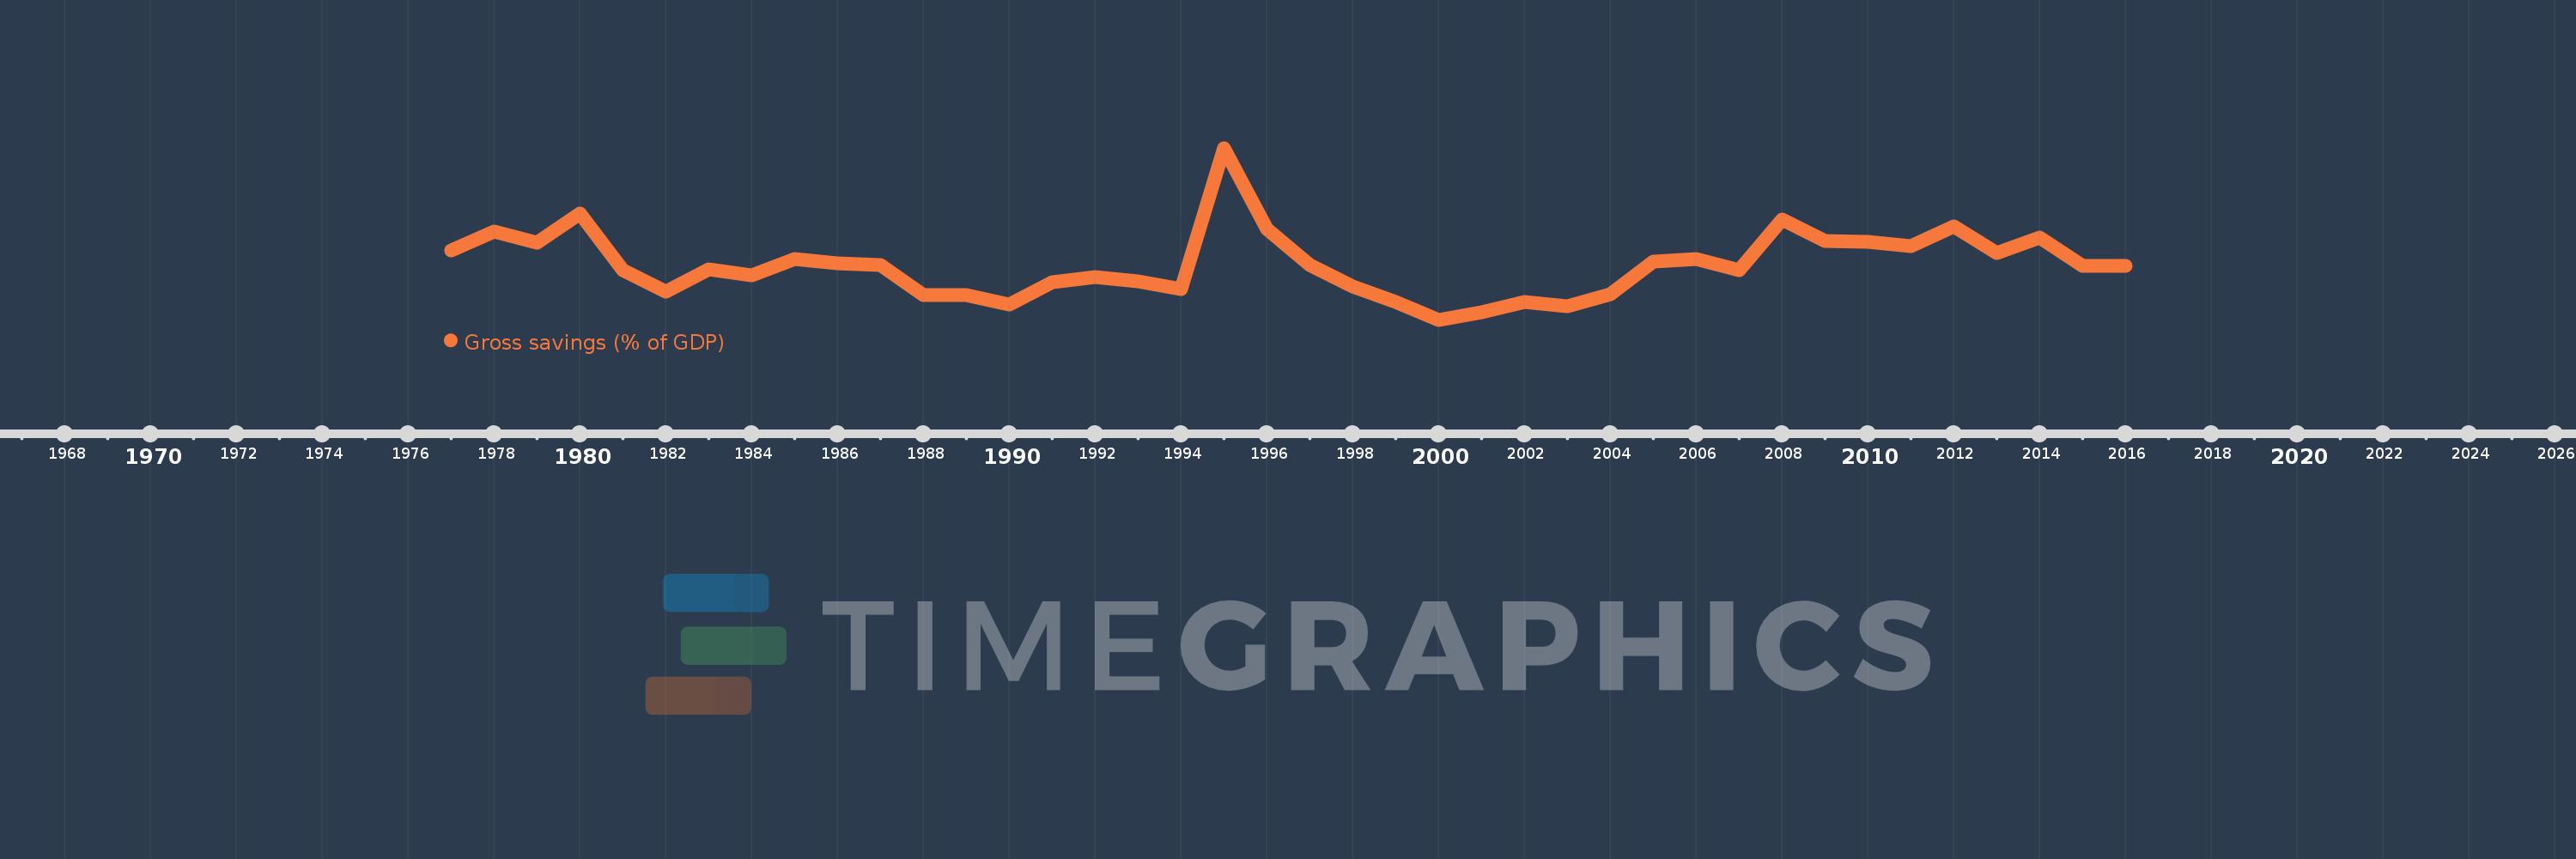
Gross savings (% of GDP)
2016,2015,2014,2013,2012,2011,2010,2009,2008,2007,2006,2005,2004,2003,2002,2001,2000,1999,1998,1997,1996,1995,1994,1993,1992,1991,1990,1989,1988,1987,1986,1985,1984,1983,1982,1981,1980,1979,1978,1977
Cette statistique dans les autres pays:
AfghanistanAlbaniaAlgeriaAngolaAntigua and BarbudaArab WorldArgentinaArmeniaAustraliaAustriaAzerbaijanBahamas, TheBahrainBangladeshBarbadosBelarusBelgiumBelizeBeninBermudaBhutanBoliviaBosnia and HerzegovinaBotswanaBrazilBrunei DarussalamBulgariaBurkina FasoBurundiCabo VerdeCambodiaCameroonCanadaCaribbean small statesCentral African RepublicCentral Europe and the BalticsChadChileChinaColombiaComorosCongo, Dem. Rep.Congo, Rep.Costa RicaCote d'IvoireCroatiaCyprusCzech RepublicDenmarkDjiboutiDominicaDominican RepublicEarly-demographic dividendEast Asia & PacificEast Asia & Pacific (excluding high income)East Asia & Pacific (IDA & IBRD countries)EcuadorEgypt, Arab Rep.El SalvadorEquatorial GuineaEritreaEstoniaEthiopiaEuro areaEurope & Central AsiaEurope & Central Asia (excluding high income)Europe & Central Asia (IDA & IBRD countries)European UnionFaroe IslandsFijiFinlandFragile and conflict affected situationsFranceGabonGambia, TheGeorgiaGermanyGhanaGreeceGrenadaGuatemalaGuineaGuinea-BissauGuyanaHaitiHeavily indebted poor countries (HIPC)High incomeHondurasHong Kong SAR, ChinaHungaryIBRD onlyIcelandIDA & IBRD totalIDA blendIDA onlyIDA totalIndiaIndonesiaIran, Islamic Rep.IraqIrelandIsraelItalyJamaicaJapanJordanKazakhstanKenyaKiribatiKorea, Rep.KosovoKuwaitKyrgyz RepublicLao PDRLate-demographic dividendLatin America & Caribbean Latin America & Caribbean (excluding high income)Latin America & the Caribbean (IDA & IBRD countries)LatviaLeast developed countries: UN classificationLebanonLesothoLiberiaLibyaLithuaniaLow & middle incomeLow incomeLower middle incomeLuxembourgMacao SAR, ChinaMacedonia, FYRMadagascarMalawiMalaysiaMaldivesMaliMaltaMauritaniaMauritiusMexicoMiddle East & North AfricaMiddle East & North Africa (excluding high income)Middle East & North Africa (IDA & IBRD countries)Middle incomeMoldovaMongoliaMontenegroMoroccoMozambiqueNamibiaNepalNetherlandsNew ZealandNicaraguaNigerNigeriaNorth AmericaNorwayOECD membersOmanOther small statesPacific island small statesPakistanPanamaPapua New GuineaParaguayPeruPhilippinesPolandPortugalPost-demographic dividendPre-demographic dividendQatarRomaniaRussian FederationRwandaSaudi ArabiaSenegalSerbiaSeychellesSierra LeoneSingaporeSlovak RepublicSloveniaSmall statesSolomon IslandsSouth AfricaSouth AsiaSouth Asia (IDA & IBRD)South SudanSpainSri LankaSt. Kitts and NevisSt. LuciaSt. Vincent and the GrenadinesSub-Saharan Africa Sub-Saharan Africa (excluding high income)Sub-Saharan Africa (IDA & IBRD countries)SudanSurinameSwazilandSwedenSwitzerlandSyrian Arab RepublicTajikistanTanzaniaThailandTimor-LesteTogoTongaTrinidad and TobagoTunisiaTurkeyUgandaUkraineUnited KingdomUnited StatesUpper middle incomeUruguayVanuatuVenezuela, RBVietnamWest Bank and GazaWorldYemen, Rep.ZambiaZimbabwe La ligne de temps
Cette échelle de temps montre un graphique de 1977 année à 2016 année Rwanda. Les données jusqu'à 1976 année ne sont pas présentés. Quantité d'observations actuelles selon dates: 40.
Source (désignation):
Les indicateurs du développement mondiale
Source (organisation):
World Bank national accounts data, and OECD National Accounts data files.
Catégories:
Economy & Growth
Dernière mise à jour
23 avr. 2017
Les indicateurs de changement de valeurs selon les années
Minimum:
5.069
1 janv. 2000
Maximum:
33.659
1 janv. 1995
Pour la date d''observation
Valeur
Changement absolu
Le changement par rapport à la valeur précédente
1 janv. 1977
16.622
+16.622
0.0%
1 janv. 1978
19.736
+3.114
18.74%
1 janv. 1979
17.923
-1.813
-9.18%
1 janv. 1980
22.682
+4.758
26.55%
1 janv. 1981
13.266
-9.416
-41.51%
1 janv. 1982
9.755
-3.512
-26.47%
1 janv. 1983
13.477
+3.722
38.16%
1 janv. 1984
12.444
-1.033
-7.67%
1 janv. 1985
15.213
+2.77
22.26%
1 janv. 1986
14.509
-0.704
-4.63%
1 janv. 1987
14.134
-0.375
-2.59%
1 janv. 1988
9.147
-4.986
-35.28%
1 janv. 1989
9.172
+0.025
0.27%
1 janv. 1990
7.535
-1.637
-17.85%
1 janv. 1991
11.325
+3.79
50.29%
1 janv. 1992
12.175
+0.85
7.51%
1 janv. 1993
11.423
-0.752
-6.18%
1 janv. 1994
10.208
-1.215
-10.64%
1 janv. 1995
33.659
+23.451
229.74%
1 janv. 1996
20.219
-13.44
-39.93%
1 janv. 1997
14.21
-6.008
-29.72%
1 janv. 1998
10.54
-3.67
-25.83%
1 janv. 1999
8.01
-2.53
-24.0%
1 janv. 2000
5.069
-2.942
-36.72%
1 janv. 2001
6.355
+1.286
25.38%
1 janv. 2002
8.055
+1.7
26.76%
1 janv. 2003
7.285
-0.77
-9.56%
1 janv. 2004
9.37
+2.085
28.62%
1 janv. 2005
14.808
+5.438
58.03%
1 janv. 2006
15.178
+0.37
2.5%
1 janv. 2007
13.275
-1.904
-12.54%
1 janv. 2008
21.69
+8.415
63.39%
1 janv. 2009
18.2
-3.49
-16.09%
1 janv. 2010
18.106
-0.094
-0.52%
1 janv. 2011
17.313
-0.793
-4.38%
1 janv. 2012
20.608
+3.294
19.03%
1 janv. 2013
16.185
-4.423
-21.46%
1 janv. 2014
18.808
+2.623
16.21%
1 janv. 2015
14.094
-4.715
-25.07%
1 janv. 2016
14.075
-0.018
-0.13%
Classement des pays selon les statistiques actuelles par années


Commentaires: