29
/fr/
fr
AIzaSyAYiBZKx7MnpbEhh9jyipgxe19OcubqV5w
April 1, 2024
133217
Finland
FIN
true
2
1
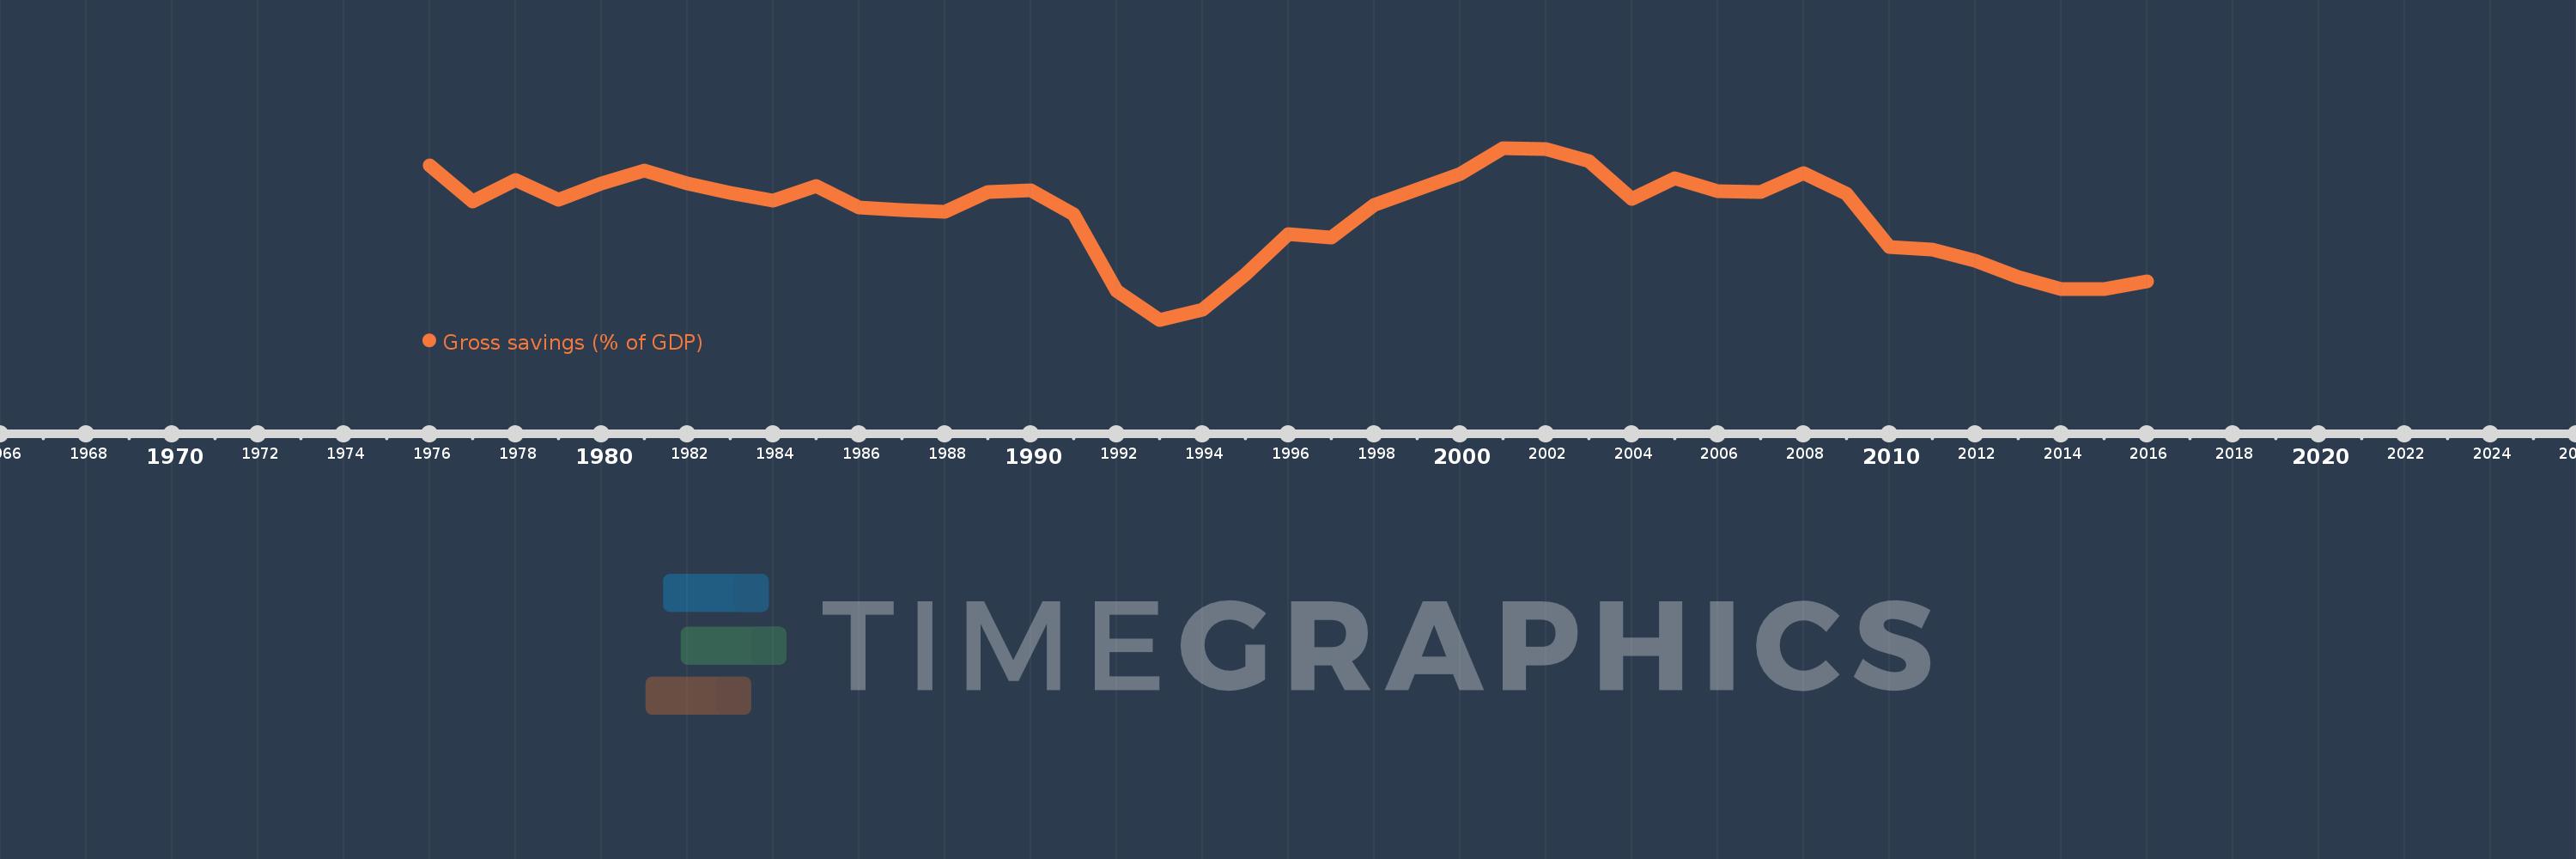
Gross savings (% of GDP)
2016,2015,2014,2013,2012,2011,2010,2009,2008,2007,2006,2005,2004,2003,2002,2001,2000,1999,1998,1997,1996,1995,1994,1993,1992,1991,1990,1989,1988,1987,1986,1985,1984,1983,1982,1981,1980,1979,1978,1977,1976
Cette statistique dans les autres pays:
AfghanistanAlbaniaAlgeriaAngolaAntigua and BarbudaArab WorldArgentinaArmeniaAustraliaAustriaAzerbaijanBahamas, TheBahrainBangladeshBarbadosBelarusBelgiumBelizeBeninBermudaBhutanBoliviaBosnia and HerzegovinaBotswanaBrazilBrunei DarussalamBulgariaBurkina FasoBurundiCabo VerdeCambodiaCameroonCanadaCaribbean small statesCentral African RepublicCentral Europe and the BalticsChadChileChinaColombiaComorosCongo, Dem. Rep.Congo, Rep.Costa RicaCote d'IvoireCroatiaCyprusCzech RepublicDenmarkDjiboutiDominicaDominican RepublicEarly-demographic dividendEast Asia & PacificEast Asia & Pacific (excluding high income)East Asia & Pacific (IDA & IBRD countries)EcuadorEgypt, Arab Rep.El SalvadorEquatorial GuineaEritreaEstoniaEthiopiaEuro areaEurope & Central AsiaEurope & Central Asia (excluding high income)Europe & Central Asia (IDA & IBRD countries)European UnionFaroe IslandsFijiFinlandFragile and conflict affected situationsFranceGabonGambia, TheGeorgiaGermanyGhanaGreeceGrenadaGuatemalaGuineaGuinea-BissauGuyanaHaitiHeavily indebted poor countries (HIPC)High incomeHondurasHong Kong SAR, ChinaHungaryIBRD onlyIcelandIDA & IBRD totalIDA blendIDA onlyIDA totalIndiaIndonesiaIran, Islamic Rep.IraqIrelandIsraelItalyJamaicaJapanJordanKazakhstanKenyaKiribatiKorea, Rep.KosovoKuwaitKyrgyz RepublicLao PDRLate-demographic dividendLatin America & Caribbean Latin America & Caribbean (excluding high income)Latin America & the Caribbean (IDA & IBRD countries)LatviaLeast developed countries: UN classificationLebanonLesothoLiberiaLibyaLithuaniaLow & middle incomeLow incomeLower middle incomeLuxembourgMacao SAR, ChinaMacedonia, FYRMadagascarMalawiMalaysiaMaldivesMaliMaltaMauritaniaMauritiusMexicoMiddle East & North AfricaMiddle East & North Africa (excluding high income)Middle East & North Africa (IDA & IBRD countries)Middle incomeMoldovaMongoliaMontenegroMoroccoMozambiqueNamibiaNepalNetherlandsNew ZealandNicaraguaNigerNigeriaNorth AmericaNorwayOECD membersOmanOther small statesPacific island small statesPakistanPanamaPapua New GuineaParaguayPeruPhilippinesPolandPortugalPost-demographic dividendPre-demographic dividendQatarRomaniaRussian FederationRwandaSaudi ArabiaSenegalSerbiaSeychellesSierra LeoneSingaporeSlovak RepublicSloveniaSmall statesSolomon IslandsSouth AfricaSouth AsiaSouth Asia (IDA & IBRD)South SudanSpainSri LankaSt. Kitts and NevisSt. LuciaSt. Vincent and the GrenadinesSub-Saharan Africa Sub-Saharan Africa (excluding high income)Sub-Saharan Africa (IDA & IBRD countries)SudanSurinameSwazilandSwedenSwitzerlandSyrian Arab RepublicTajikistanTanzaniaThailandTimor-LesteTogoTongaTrinidad and TobagoTunisiaTurkeyUgandaUkraineUnited KingdomUnited StatesUpper middle incomeUruguayVanuatuVenezuela, RBVietnamWest Bank and GazaWorldYemen, Rep.ZambiaZimbabwe La ligne de temps
Cette échelle de temps montre un graphique de 1976 année à 2016 année Finland. Les données jusqu'à 1975 année ne sont pas présentés. Quantité d'observations actuelles selon dates: 41.
Source (désignation):
Les indicateurs du développement mondiale
Source (organisation):
World Bank national accounts data, and OECD National Accounts data files.
Catégories:
Economy & Growth
Dernière mise à jour
23 avr. 2017
Les indicateurs de changement de valeurs selon les années
Minimum:
17.085
1 janv. 1993
Maximum:
31.875
1 janv. 2001
Pour la date d''observation
Valeur
Changement absolu
Le changement par rapport à la valeur précédente
1 janv. 1976
30.392
+30.392
0.0%
1 janv. 1977
27.233
-3.159
-10.39%
1 janv. 1978
29.151
+1.919
7.05%
1 janv. 1979
27.391
-1.761
-6.04%
1 janv. 1980
28.822
+1.432
5.23%
1 janv. 1981
29.954
+1.131
3.93%
1 janv. 1982
28.801
-1.153
-3.85%
1 janv. 1983
28.037
-0.764
-2.65%
1 janv. 1984
27.35
-0.687
-2.45%
1 janv. 1985
28.576
+1.225
4.48%
1 janv. 1986
26.724
-1.852
-6.48%
1 janv. 1987
26.515
-0.209
-0.78%
1 janv. 1988
26.4
-0.116
-0.44%
1 janv. 1989
28.089
+1.689
6.4%
1 janv. 1990
28.193
+0.104
0.37%
1 janv. 1991
26.129
-2.064
-7.32%
1 janv. 1992
19.548
-6.581
-25.19%
1 janv. 1993
17.085
-2.463
-12.6%
1 janv. 1994
17.975
+0.89
5.21%
1 janv. 1995
20.979
+3.004
16.71%
1 janv. 1996
24.43
+3.451
16.45%
1 janv. 1997
24.156
-0.274
-1.12%
1 janv. 1998
26.936
+2.78
11.51%
1 janv. 1999
28.273
+1.337
4.96%
1 janv. 2000
29.643
+1.37
4.84%
1 janv. 2001
31.875
+2.232
7.53%
1 janv. 2002
31.801
-0.073
-0.23%
1 janv. 2003
30.734
-1.067
-3.36%
1 janv. 2004
27.507
-3.227
-10.5%
1 janv. 2005
29.252
+1.745
6.34%
1 janv. 2006
28.181
-1.071
-3.66%
1 janv. 2007
28.109
-0.072
-0.26%
1 janv. 2008
29.693
+1.584
5.64%
1 janv. 2009
27.913
-1.78
-5.99%
1 janv. 2010
23.344
-4.57
-16.37%
1 janv. 2011
23.156
-0.187
-0.8%
1 janv. 2012
22.145
-1.011
-4.37%
1 janv. 2013
20.752
-1.393
-6.29%
1 janv. 2014
19.704
-1.049
-5.05%
1 janv. 2015
19.717
+0.014
0.07%
1 janv. 2016
20.415
+0.697
3.54%
Classement des pays selon les statistiques actuelles par années


Commentaires: