29
/fr/
fr
AIzaSyAYiBZKx7MnpbEhh9jyipgxe19OcubqV5w
April 1, 2024
121001
Dominica
DMA
true
2
1
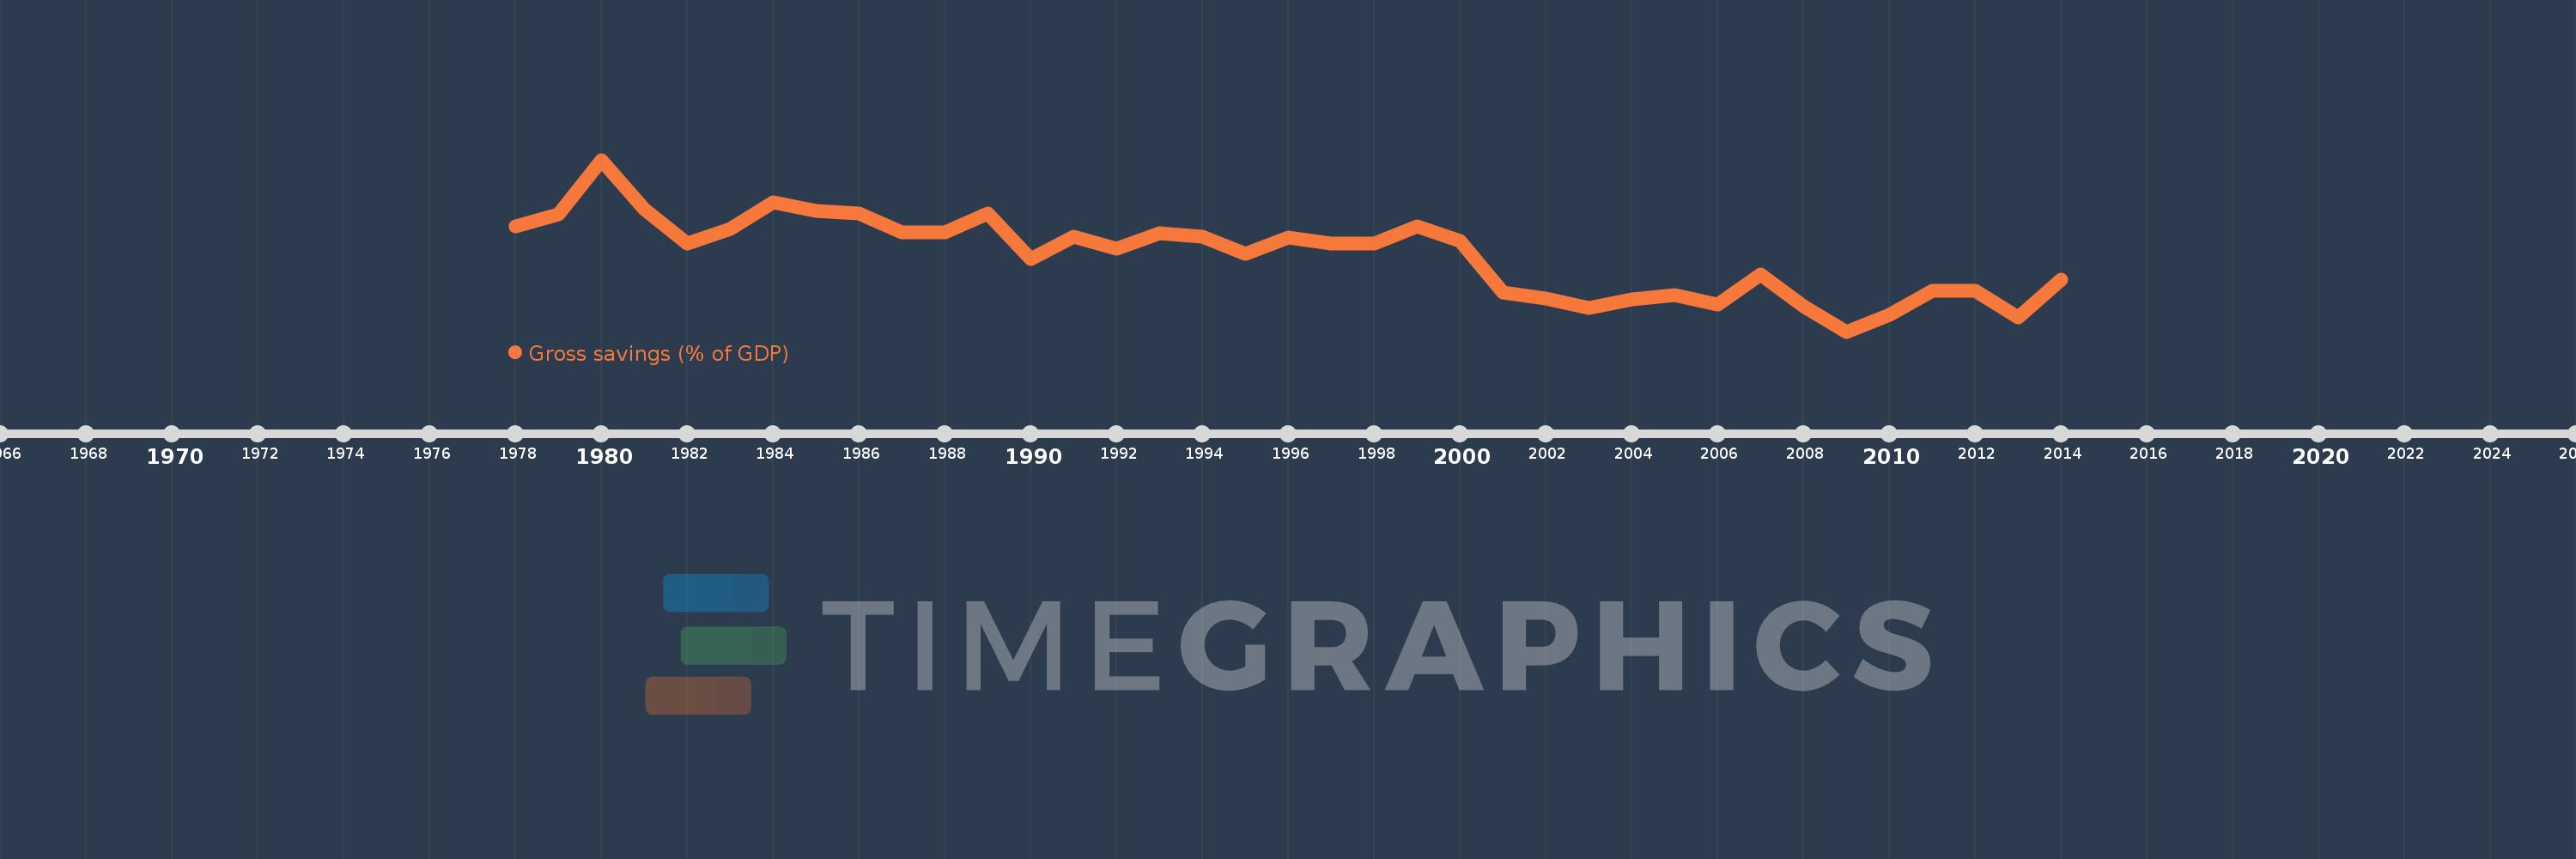
Gross savings (% of GDP)
2014,2013,2012,2011,2010,2009,2008,2007,2006,2005,2004,2003,2002,2001,2000,1999,1998,1997,1996,1995,1994,1993,1992,1991,1990,1989,1988,1987,1986,1985,1984,1983,1982,1981,1980,1979,1978
Cette statistique dans les autres pays:
AfghanistanAlbaniaAlgeriaAngolaAntigua and BarbudaArab WorldArgentinaArmeniaAustraliaAustriaAzerbaijanBahamas, TheBahrainBangladeshBarbadosBelarusBelgiumBelizeBeninBermudaBhutanBoliviaBosnia and HerzegovinaBotswanaBrazilBrunei DarussalamBulgariaBurkina FasoBurundiCabo VerdeCambodiaCameroonCanadaCaribbean small statesCentral African RepublicCentral Europe and the BalticsChadChileChinaColombiaComorosCongo, Dem. Rep.Congo, Rep.Costa RicaCote d'IvoireCroatiaCyprusCzech RepublicDenmarkDjiboutiDominicaDominican RepublicEarly-demographic dividendEast Asia & PacificEast Asia & Pacific (excluding high income)East Asia & Pacific (IDA & IBRD countries)EcuadorEgypt, Arab Rep.El SalvadorEquatorial GuineaEritreaEstoniaEthiopiaEuro areaEurope & Central AsiaEurope & Central Asia (excluding high income)Europe & Central Asia (IDA & IBRD countries)European UnionFaroe IslandsFijiFinlandFragile and conflict affected situationsFranceGabonGambia, TheGeorgiaGermanyGhanaGreeceGrenadaGuatemalaGuineaGuinea-BissauGuyanaHaitiHeavily indebted poor countries (HIPC)High incomeHondurasHong Kong SAR, ChinaHungaryIBRD onlyIcelandIDA & IBRD totalIDA blendIDA onlyIDA totalIndiaIndonesiaIran, Islamic Rep.IraqIrelandIsraelItalyJamaicaJapanJordanKazakhstanKenyaKiribatiKorea, Rep.KosovoKuwaitKyrgyz RepublicLao PDRLate-demographic dividendLatin America & Caribbean Latin America & Caribbean (excluding high income)Latin America & the Caribbean (IDA & IBRD countries)LatviaLeast developed countries: UN classificationLebanonLesothoLiberiaLibyaLithuaniaLow & middle incomeLow incomeLower middle incomeLuxembourgMacao SAR, ChinaMacedonia, FYRMadagascarMalawiMalaysiaMaldivesMaliMaltaMauritaniaMauritiusMexicoMiddle East & North AfricaMiddle East & North Africa (excluding high income)Middle East & North Africa (IDA & IBRD countries)Middle incomeMoldovaMongoliaMontenegroMoroccoMozambiqueNamibiaNepalNetherlandsNew ZealandNicaraguaNigerNigeriaNorth AmericaNorwayOECD membersOmanOther small statesPacific island small statesPakistanPanamaPapua New GuineaParaguayPeruPhilippinesPolandPortugalPost-demographic dividendPre-demographic dividendQatarRomaniaRussian FederationRwandaSaudi ArabiaSenegalSerbiaSeychellesSierra LeoneSingaporeSlovak RepublicSloveniaSmall statesSolomon IslandsSouth AfricaSouth AsiaSouth Asia (IDA & IBRD)South SudanSpainSri LankaSt. Kitts and NevisSt. LuciaSt. Vincent and the GrenadinesSub-Saharan Africa Sub-Saharan Africa (excluding high income)Sub-Saharan Africa (IDA & IBRD countries)SudanSurinameSwazilandSwedenSwitzerlandSyrian Arab RepublicTajikistanTanzaniaThailandTimor-LesteTogoTongaTrinidad and TobagoTunisiaTurkeyUgandaUkraineUnited KingdomUnited StatesUpper middle incomeUruguayVanuatuVenezuela, RBVietnamWest Bank and GazaWorldYemen, Rep.ZambiaZimbabwe La ligne de temps
Cette échelle de temps montre un graphique de 1978 année à 2014 année Dominica. Les données jusqu'à 1977 année ne sont pas présentés. Quantité d'observations actuelles selon dates: 37.
Source (désignation):
Les indicateurs du développement mondiale
Source (organisation):
World Bank national accounts data, and OECD National Accounts data files.
Catégories:
Economy & Growth
Dernière mise à jour
23 avr. 2017
Les indicateurs de changement de valeurs selon les années
Minimum:
-7.249
1 janv. 2009
Maximum:
33.829
1 janv. 1980
Pour la date d''observation
Valeur
Changement absolu
Le changement par rapport à la valeur précédente
1 janv. 1978
17.821
+17.821
0.0%
1 janv. 1979
20.761
+2.94
16.5%
1 janv. 1980
33.829
+13.069
62.95%
1 janv. 1981
22.091
-11.739
-34.7%
1 janv. 1982
13.811
-8.279
-37.48%
1 janv. 1983
17.274
+3.463
25.07%
1 janv. 1984
23.658
+6.384
36.96%
1 janv. 1985
21.54
-2.118
-8.95%
1 janv. 1986
20.898
-0.642
-2.98%
1 janv. 1987
16.457
-4.441
-21.25%
1 janv. 1988
16.523
+0.066
0.4%
1 janv. 1989
21.088
+4.564
27.62%
1 janv. 1990
10.133
-10.955
-51.95%
1 janv. 1991
15.357
+5.225
51.56%
1 janv. 1992
12.576
-2.781
-18.11%
1 janv. 1993
16.292
+3.715
29.54%
1 janv. 1994
15.479
-0.813
-4.99%
1 janv. 1995
11.338
-4.14
-26.75%
1 janv. 1996
15.313
+3.975
35.06%
1 janv. 1997
13.806
-1.507
-9.84%
1 janv. 1998
13.87
+0.063
0.46%
1 janv. 1999
17.96
+4.091
29.49%
1 janv. 2000
14.344
-3.617
-20.14%
1 janv. 2001
2.01
-12.333
-85.98%
1 janv. 2002
0.611
-1.4
-69.63%
1 janv. 2003
-1.532
-2.143
-350.88%
1 janv. 2004
0.402
+1.934
-126.27%
1 janv. 2005
1.533
+1.13
280.87%
1 janv. 2006
-0.79
-2.323
-151.56%
1 janv. 2007
6.358
+7.148
-904.64%
1 janv. 2008
-1.194
-7.552
-118.78%
1 janv. 2009
-7.249
-6.055
507.17%
1 janv. 2010
-3.331
+3.918
-54.05%
1 janv. 2011
2.462
+5.793
-173.92%
1 janv. 2012
2.496
+0.034
1.39%
1 janv. 2013
-3.92
-6.416
-257.01%
1 janv. 2014
5.205
+9.125
-232.8%
Classement des pays selon les statistiques actuelles par années


Commentaires: