29
/fr/
fr
AIzaSyAYiBZKx7MnpbEhh9jyipgxe19OcubqV5w
April 1, 2024
258113
Syrian Arab Republic
SYR
true
2
1
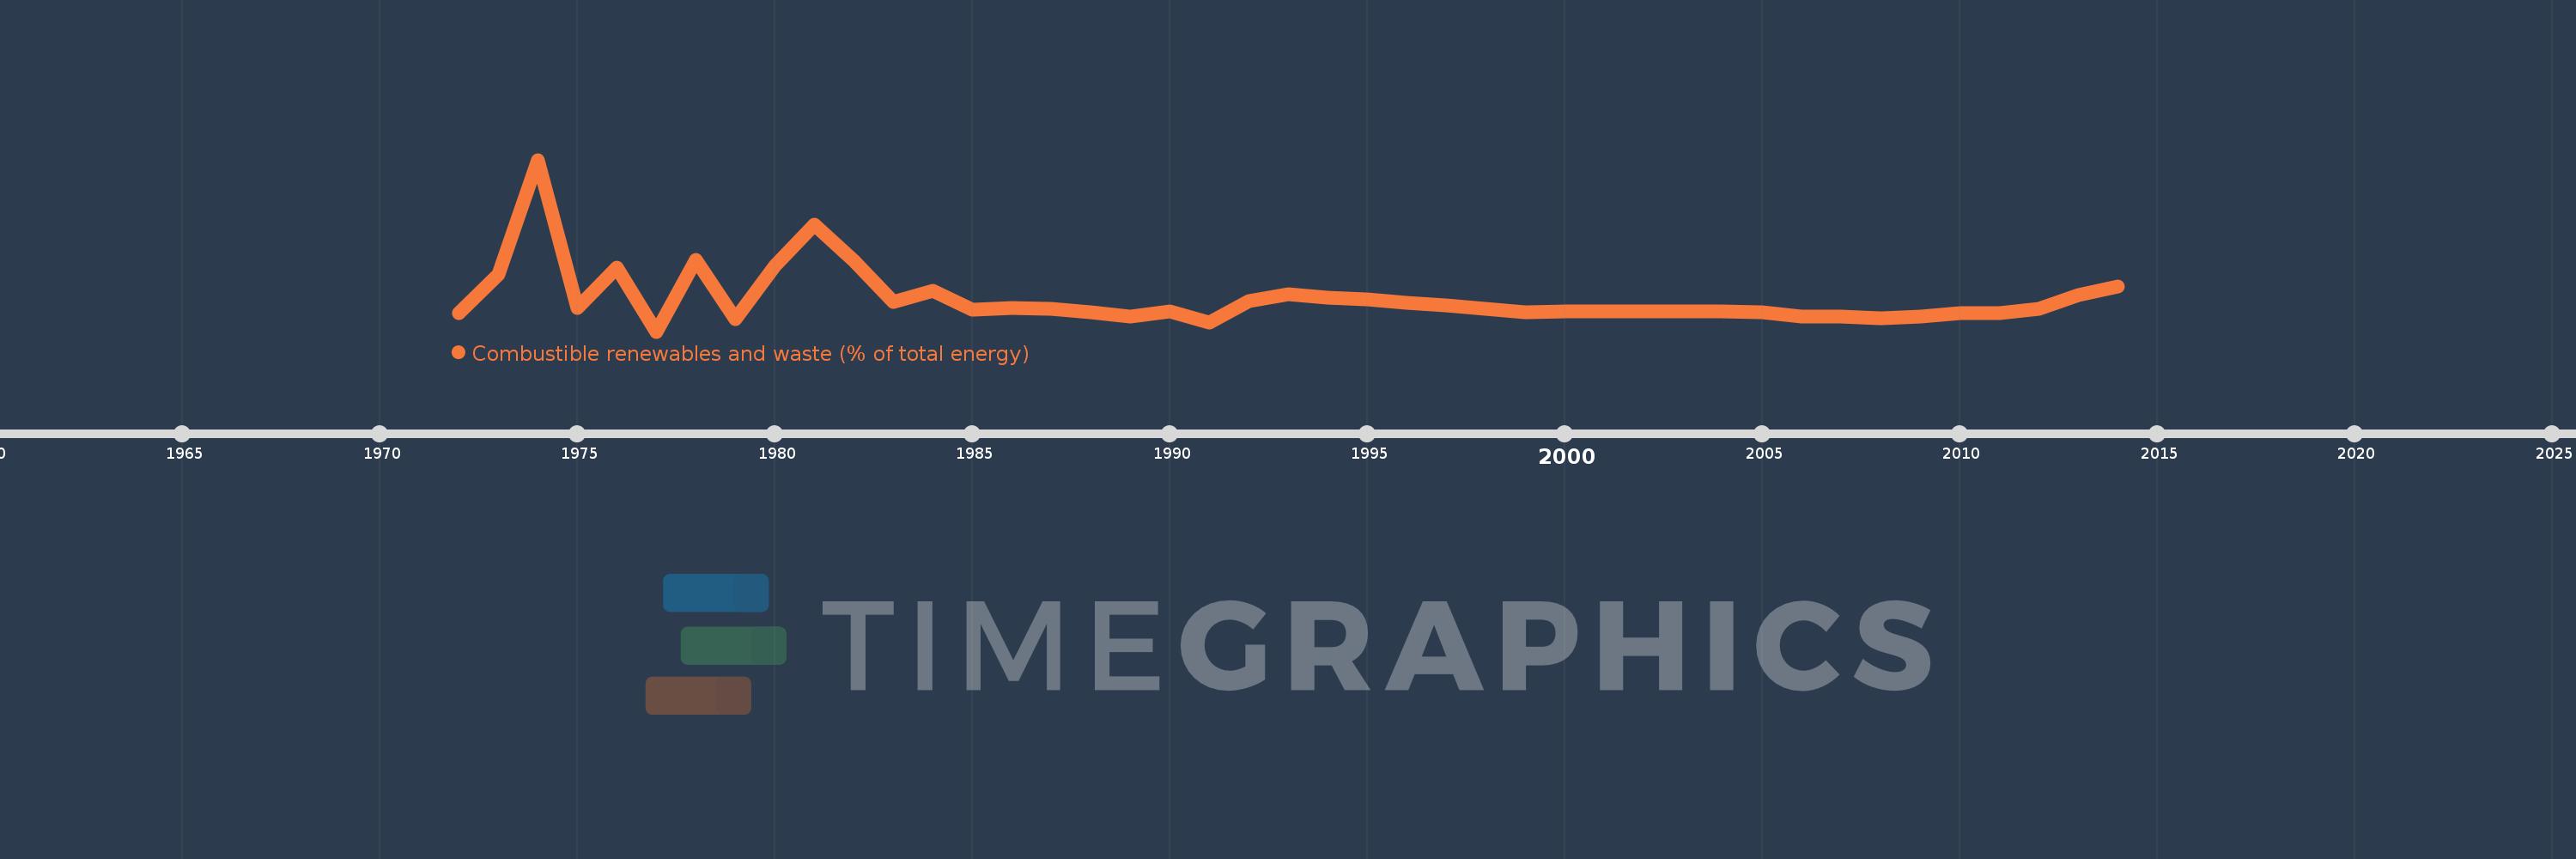
Combustible renewables and waste (% of total energy)
2014,2013,2012,2011,2010,2009,2008,2007,2006,2005,2004,2003,2002,2001,2000,1999,1998,1997,1996,1995,1994,1993,1992,1991,1990,1989,1988,1987,1986,1985,1984,1983,1982,1981,1980,1979,1978,1977,1976,1975,1974,1973,1972
Cette statistique dans les autres pays:
AlbaniaAlgeriaAngolaArab WorldArgentinaArmeniaAustraliaAustriaAzerbaijanBahrainBangladeshBelarusBelgiumBeninBoliviaBosnia and HerzegovinaBotswanaBrazilBrunei DarussalamBulgariaCambodiaCameroonCanadaCaribbean small statesCentral Europe and the BalticsChileChinaColombiaCongo, Dem. Rep.Congo, Rep.Costa RicaCote d'IvoireCroatiaCubaCuracaoCyprusCzech RepublicDenmarkDominican RepublicEarly-demographic dividendEast Asia & PacificEast Asia & Pacific (excluding high income)East Asia & Pacific (IDA & IBRD countries)EcuadorEgypt, Arab Rep.El SalvadorEritreaEstoniaEthiopiaEuro areaEurope & Central AsiaEurope & Central Asia (excluding high income)Europe & Central Asia (IDA & IBRD countries)European UnionFinlandFragile and conflict affected situationsFranceGabonGeorgiaGermanyGhanaGibraltarGreeceGuatemalaHaitiHeavily indebted poor countries (HIPC)High incomeHondurasHong Kong SAR, ChinaHungaryIBRD onlyIcelandIDA & IBRD totalIDA blendIDA onlyIDA totalIndiaIndonesiaIran, Islamic Rep.IraqIrelandIsraelItalyJamaicaJapanJordanKazakhstanKenyaKorea, Dem. People’s Rep.Korea, Rep.KosovoKuwaitKyrgyz RepublicLate-demographic dividendLatin America & Caribbean Latin America & Caribbean (excluding high income)Latin America & the Caribbean (IDA & IBRD countries)LatviaLeast developed countries: UN classificationLebanonLibyaLithuaniaLow & middle incomeLow incomeLower middle incomeLuxembourgMacedonia, FYRMalaysiaMaltaMauritiusMexicoMiddle East & North AfricaMiddle East & North Africa (excluding high income)Middle East & North Africa (IDA & IBRD countries)Middle incomeMoldovaMongoliaMontenegroMoroccoMozambiqueMyanmarNamibiaNepalNetherlandsNew ZealandNicaraguaNigerNigeriaNorth AmericaNorwayOECD membersOmanOther small statesPakistanPanamaParaguayPeruPhilippinesPolandPortugalPost-demographic dividendPre-demographic dividendQatarRomaniaRussian FederationSaudi ArabiaSenegalSerbiaSingaporeSlovak RepublicSloveniaSmall statesSouth AfricaSouth AsiaSouth Asia (IDA & IBRD)South SudanSpainSri LankaSub-Saharan Africa Sub-Saharan Africa (excluding high income)Sub-Saharan Africa (IDA & IBRD countries)SudanSwedenSwitzerlandSyrian Arab RepublicTajikistanTanzaniaThailandTogoTrinidad and TobagoTunisiaTurkeyTurkmenistanUkraineUnited Arab EmiratesUnited KingdomUnited StatesUpper middle incomeUruguayUzbekistanVenezuela, RBVietnamWorldYemen, Rep.ZambiaZimbabwe La ligne de temps
Cette échelle de temps montre un graphique de 1972 année à 2014 année Syrian Arab Republic. Les données jusqu'à 1971 année ne sont pas présentés. Quantité d'observations actuelles selon dates: 43.
Source (désignation):
Les indicateurs du développement mondiale
Source (organisation):
IEA Statistics © OECD/IEA 2014 (http://www.iea.org/stats/index.asp), subject to https://www.iea.org/t&c/termsandconditions/
Catégories:
Energy & Mining
Dernière mise à jour
23 avr. 2017
Les indicateurs de changement de valeurs selon les années
Minimum:
0.014
1 janv. 1977
Maximum:
0.165
1 janv. 1974
Pour la date d''observation
Valeur
Changement absolu
Le changement par rapport à la valeur précédente
1 janv. 1972
0.03
+0.03
0.0%
1 janv. 1973
0.064
+0.034
112.42%
1 janv. 1974
0.165
+0.101
157.58%
1 janv. 1975
0.035
-0.13
-78.65%
1 janv. 1976
0.07
+0.034
97.89%
1 janv. 1977
0.014
-0.056
-79.97%
1 janv. 1978
0.077
+0.063
454.31%
1 janv. 1979
0.025
-0.052
-67.51%
1 janv. 1980
0.072
+0.047
186.58%
1 janv. 1981
0.108
+0.036
50.41%
1 janv. 1982
0.076
-0.032
-29.99%
1 janv. 1983
0.04
-0.036
-47.67%
1 janv. 1984
0.05
+0.01
25.96%
1 janv. 1985
0.033
-0.017
-34.18%
1 janv. 1986
0.035
+0.003
7.77%
1 janv. 1987
0.034
-0.001
-2.64%
1 janv. 1988
0.031
-0.003
-10.08%
1 janv. 1989
0.027
-0.004
-11.77%
1 janv. 1990
0.032
+0.005
17.46%
1 janv. 1991
0.022
-0.01
-31.73%
1 janv. 1992
0.041
+0.019
85.29%
1 janv. 1993
0.047
+0.006
14.76%
1 janv. 1994
0.044
-0.003
-6.66%
1 janv. 1995
0.042
-0.002
-4.16%
1 janv. 1996
0.039
-0.002
-5.44%
1 janv. 1997
0.037
-0.002
-5.29%
1 janv. 1998
0.034
-0.003
-7.9%
1 janv. 1999
0.031
-0.004
-10.26%
1 janv. 2000
0.032
+0.001
2.94%
1 janv. 2001
0.032
+0.001
2.09%
1 janv. 2002
0.032
0.0
-0.68%
1 janv. 2003
0.032
-0.001
-1.95%
1 janv. 2004
0.032
+0.0
1.32%
1 janv. 2005
0.031
-0.001
-2.15%
1 janv. 2006
0.027
-0.005
-14.65%
1 janv. 2007
0.027
0.0
-0.57%
1 janv. 2008
0.026
0.0
-0.5%
1 janv. 2009
0.027
+0.001
1.92%
1 janv. 2010
0.03
+0.003
11.19%
1 janv. 2011
0.03
+0.0
1.42%
1 janv. 2012
0.034
+0.003
10.75%
1 janv. 2013
0.046
+0.012
35.85%
1 janv. 2014
0.054
+0.008
18.38%
Classement des pays selon les statistiques actuelles par années


Commentaires: