29
/fr/
fr
AIzaSyAYiBZKx7MnpbEhh9jyipgxe19OcubqV5w
April 1, 2024
109437
Congo, Dem. Rep.
COD
true
2
1
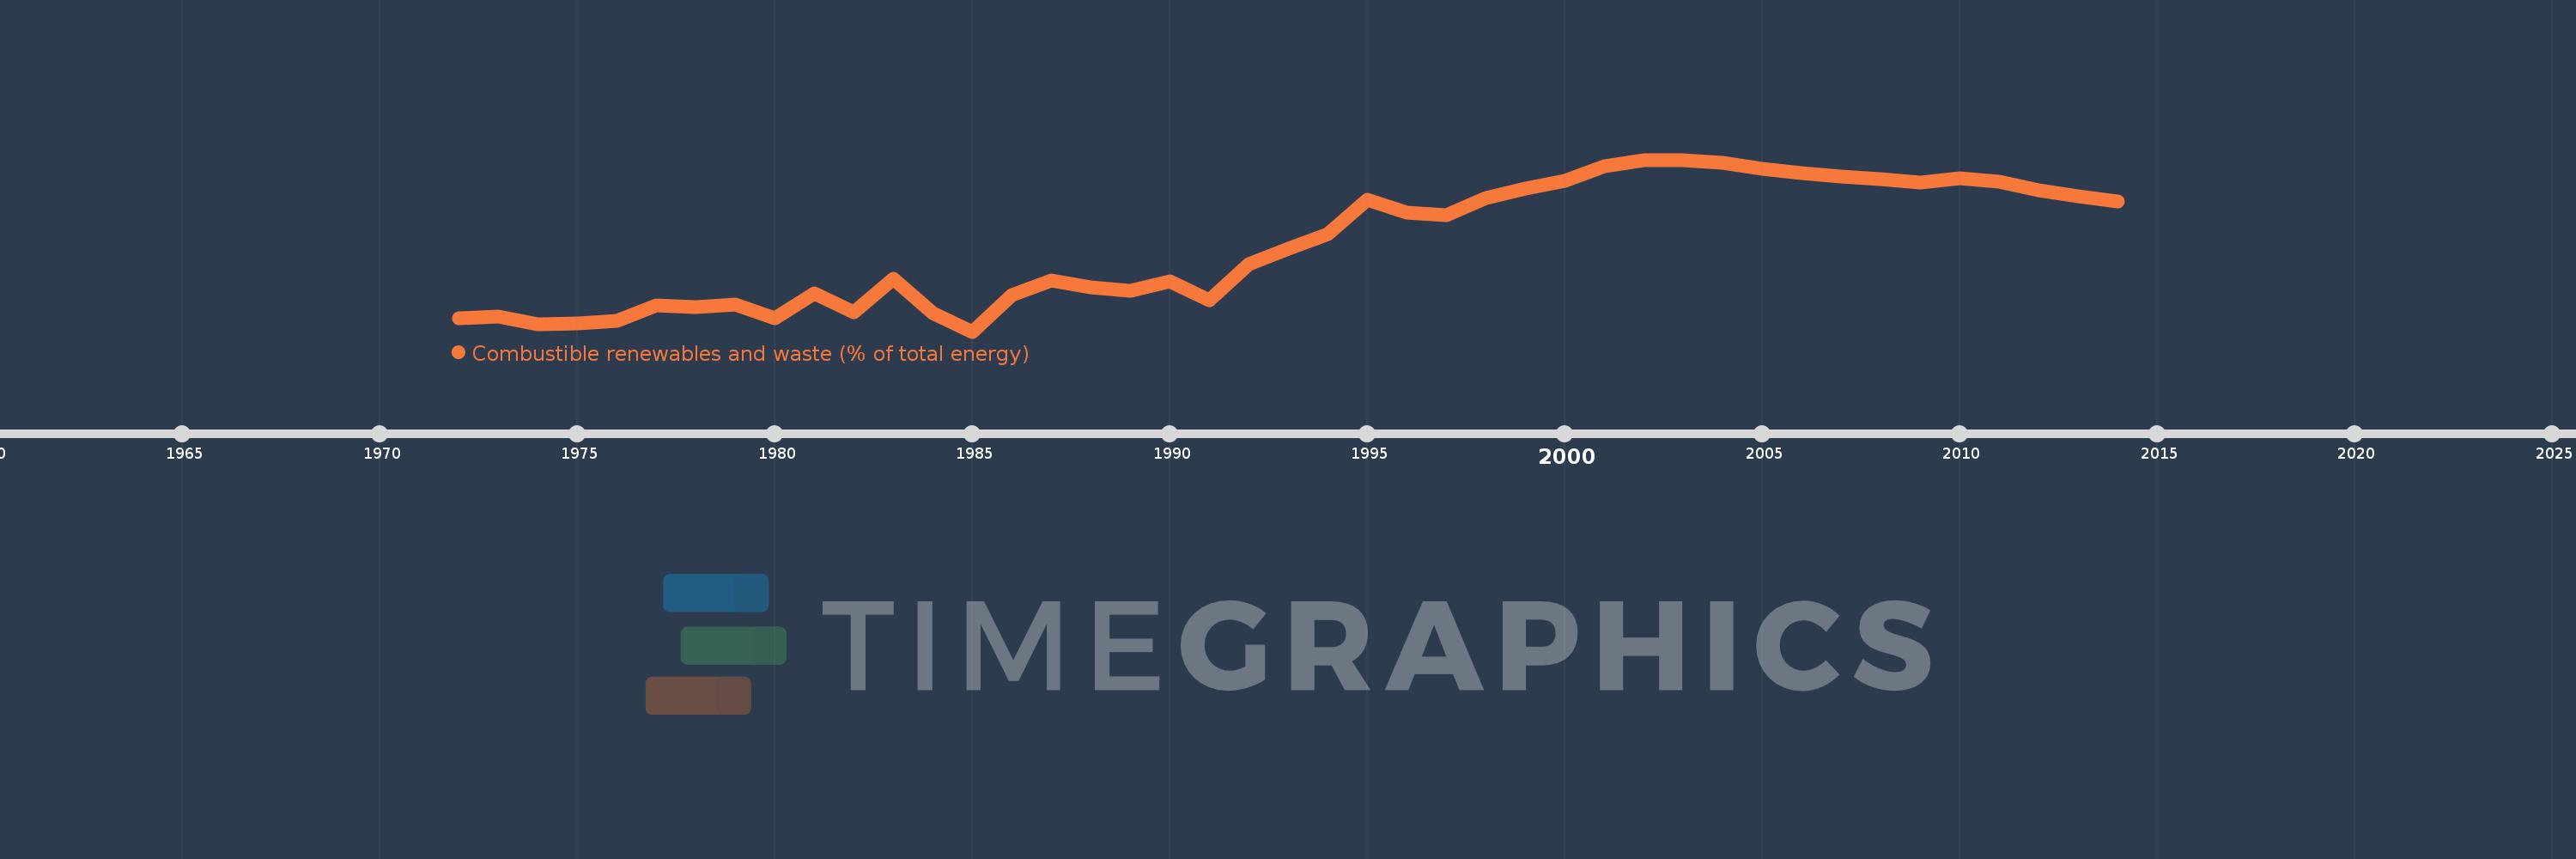
Combustible renewables and waste (% of total energy)
2014,2013,2012,2011,2010,2009,2008,2007,2006,2005,2004,2003,2002,2001,2000,1999,1998,1997,1996,1995,1994,1993,1992,1991,1990,1989,1988,1987,1986,1985,1984,1983,1982,1981,1980,1979,1978,1977,1976,1975,1974,1973,1972
Cette statistique dans les autres pays:
AlbaniaAlgeriaAngolaArab WorldArgentinaArmeniaAustraliaAustriaAzerbaijanBahrainBangladeshBelarusBelgiumBeninBoliviaBosnia and HerzegovinaBotswanaBrazilBrunei DarussalamBulgariaCambodiaCameroonCanadaCaribbean small statesCentral Europe and the BalticsChileChinaColombiaCongo, Dem. Rep.Congo, Rep.Costa RicaCote d'IvoireCroatiaCubaCuracaoCyprusCzech RepublicDenmarkDominican RepublicEarly-demographic dividendEast Asia & PacificEast Asia & Pacific (excluding high income)East Asia & Pacific (IDA & IBRD countries)EcuadorEgypt, Arab Rep.El SalvadorEritreaEstoniaEthiopiaEuro areaEurope & Central AsiaEurope & Central Asia (excluding high income)Europe & Central Asia (IDA & IBRD countries)European UnionFinlandFragile and conflict affected situationsFranceGabonGeorgiaGermanyGhanaGibraltarGreeceGuatemalaHaitiHeavily indebted poor countries (HIPC)High incomeHondurasHong Kong SAR, ChinaHungaryIBRD onlyIcelandIDA & IBRD totalIDA blendIDA onlyIDA totalIndiaIndonesiaIran, Islamic Rep.IraqIrelandIsraelItalyJamaicaJapanJordanKazakhstanKenyaKorea, Dem. People’s Rep.Korea, Rep.KosovoKuwaitKyrgyz RepublicLate-demographic dividendLatin America & Caribbean Latin America & Caribbean (excluding high income)Latin America & the Caribbean (IDA & IBRD countries)LatviaLeast developed countries: UN classificationLebanonLibyaLithuaniaLow & middle incomeLow incomeLower middle incomeLuxembourgMacedonia, FYRMalaysiaMaltaMauritiusMexicoMiddle East & North AfricaMiddle East & North Africa (excluding high income)Middle East & North Africa (IDA & IBRD countries)Middle incomeMoldovaMongoliaMontenegroMoroccoMozambiqueMyanmarNamibiaNepalNetherlandsNew ZealandNicaraguaNigerNigeriaNorth AmericaNorwayOECD membersOmanOther small statesPakistanPanamaParaguayPeruPhilippinesPolandPortugalPost-demographic dividendPre-demographic dividendQatarRomaniaRussian FederationSaudi ArabiaSenegalSerbiaSingaporeSlovak RepublicSloveniaSmall statesSouth AfricaSouth AsiaSouth Asia (IDA & IBRD)South SudanSpainSri LankaSub-Saharan Africa Sub-Saharan Africa (excluding high income)Sub-Saharan Africa (IDA & IBRD countries)SudanSwedenSwitzerlandSyrian Arab RepublicTajikistanTanzaniaThailandTogoTrinidad and TobagoTunisiaTurkeyTurkmenistanUkraineUnited Arab EmiratesUnited KingdomUnited StatesUpper middle incomeUruguayUzbekistanVenezuela, RBVietnamWorldYemen, Rep.ZambiaZimbabwe La ligne de temps
Cette échelle de temps montre un graphique de 1972 année à 2014 année Congo, Dem. Rep.. Les données jusqu'à 1971 année ne sont pas présentés. Quantité d'observations actuelles selon dates: 43.
Source (désignation):
Les indicateurs du développement mondiale
Source (organisation):
IEA Statistics © OECD/IEA 2014 (http://www.iea.org/stats/index.asp), subject to https://www.iea.org/t&c/termsandconditions/
Catégories:
Energy & Mining
Dernière mise à jour
23 avr. 2017
Les indicateurs de changement de valeurs selon les années
Minimum:
82.35
1 janv. 1985
Maximum:
95.362
1 janv. 2003
Pour la date d''observation
Valeur
Changement absolu
Le changement par rapport à la valeur précédente
1 janv. 1972
83.333
+83.333
0.0%
1 janv. 1973
83.462
+0.129
0.15%
1 janv. 1974
82.877
-0.584
-0.7%
1 janv. 1975
82.946
+0.068
0.08%
1 janv. 1976
83.187
+0.241
0.29%
1 janv. 1977
84.327
+1.141
1.37%
1 janv. 1978
84.212
-0.115
-0.14%
1 janv. 1979
84.42
+0.208
0.25%
1 janv. 1980
83.385
-1.036
-1.23%
1 janv. 1981
85.272
+1.888
2.26%
1 janv. 1982
83.807
-1.465
-1.72%
1 janv. 1983
86.369
+2.562
3.06%
1 janv. 1984
83.752
-2.617
-3.03%
1 janv. 1985
82.35
-1.402
-1.67%
1 janv. 1986
85.112
+2.762
3.35%
1 janv. 1987
86.249
+1.138
1.34%
1 janv. 1988
85.693
-0.557
-0.65%
1 janv. 1989
85.442
-0.251
-0.29%
1 janv. 1990
86.128
+0.686
0.8%
1 janv. 1991
84.74
-1.388
-1.61%
1 janv. 1992
87.428
+2.688
3.17%
1 janv. 1993
88.66
+1.232
1.41%
1 janv. 1994
89.729
+1.069
1.21%
1 janv. 1995
92.311
+2.583
2.88%
1 janv. 1996
91.347
-0.964
-1.04%
1 janv. 1997
91.172
-0.175
-0.19%
1 janv. 1998
92.464
+1.292
1.42%
1 janv. 1999
93.164
+0.7
0.76%
1 janv. 2000
93.789
+0.625
0.67%
1 janv. 2001
94.889
+1.101
1.17%
1 janv. 2002
95.349
+0.459
0.48%
1 janv. 2003
95.362
+0.013
0.01%
1 janv. 2004
95.14
-0.221
-0.23%
1 janv. 2005
94.684
-0.457
-0.48%
1 janv. 2006
94.337
-0.347
-0.37%
1 janv. 2007
94.106
-0.231
-0.24%
1 janv. 2008
93.909
-0.197
-0.21%
1 janv. 2009
93.637
-0.272
-0.29%
1 janv. 2010
93.995
+0.358
0.38%
1 janv. 2011
93.731
-0.264
-0.28%
1 janv. 2012
93.041
-0.69
-0.74%
1 janv. 2013
92.574
-0.467
-0.5%
1 janv. 2014
92.196
-0.378
-0.41%
Classement des pays selon les statistiques actuelles par années


Commentaires: