29
/fr/
fr
AIzaSyAYiBZKx7MnpbEhh9jyipgxe19OcubqV5w
April 1, 2024
112002
Costa Rica
CRI
true
2
1
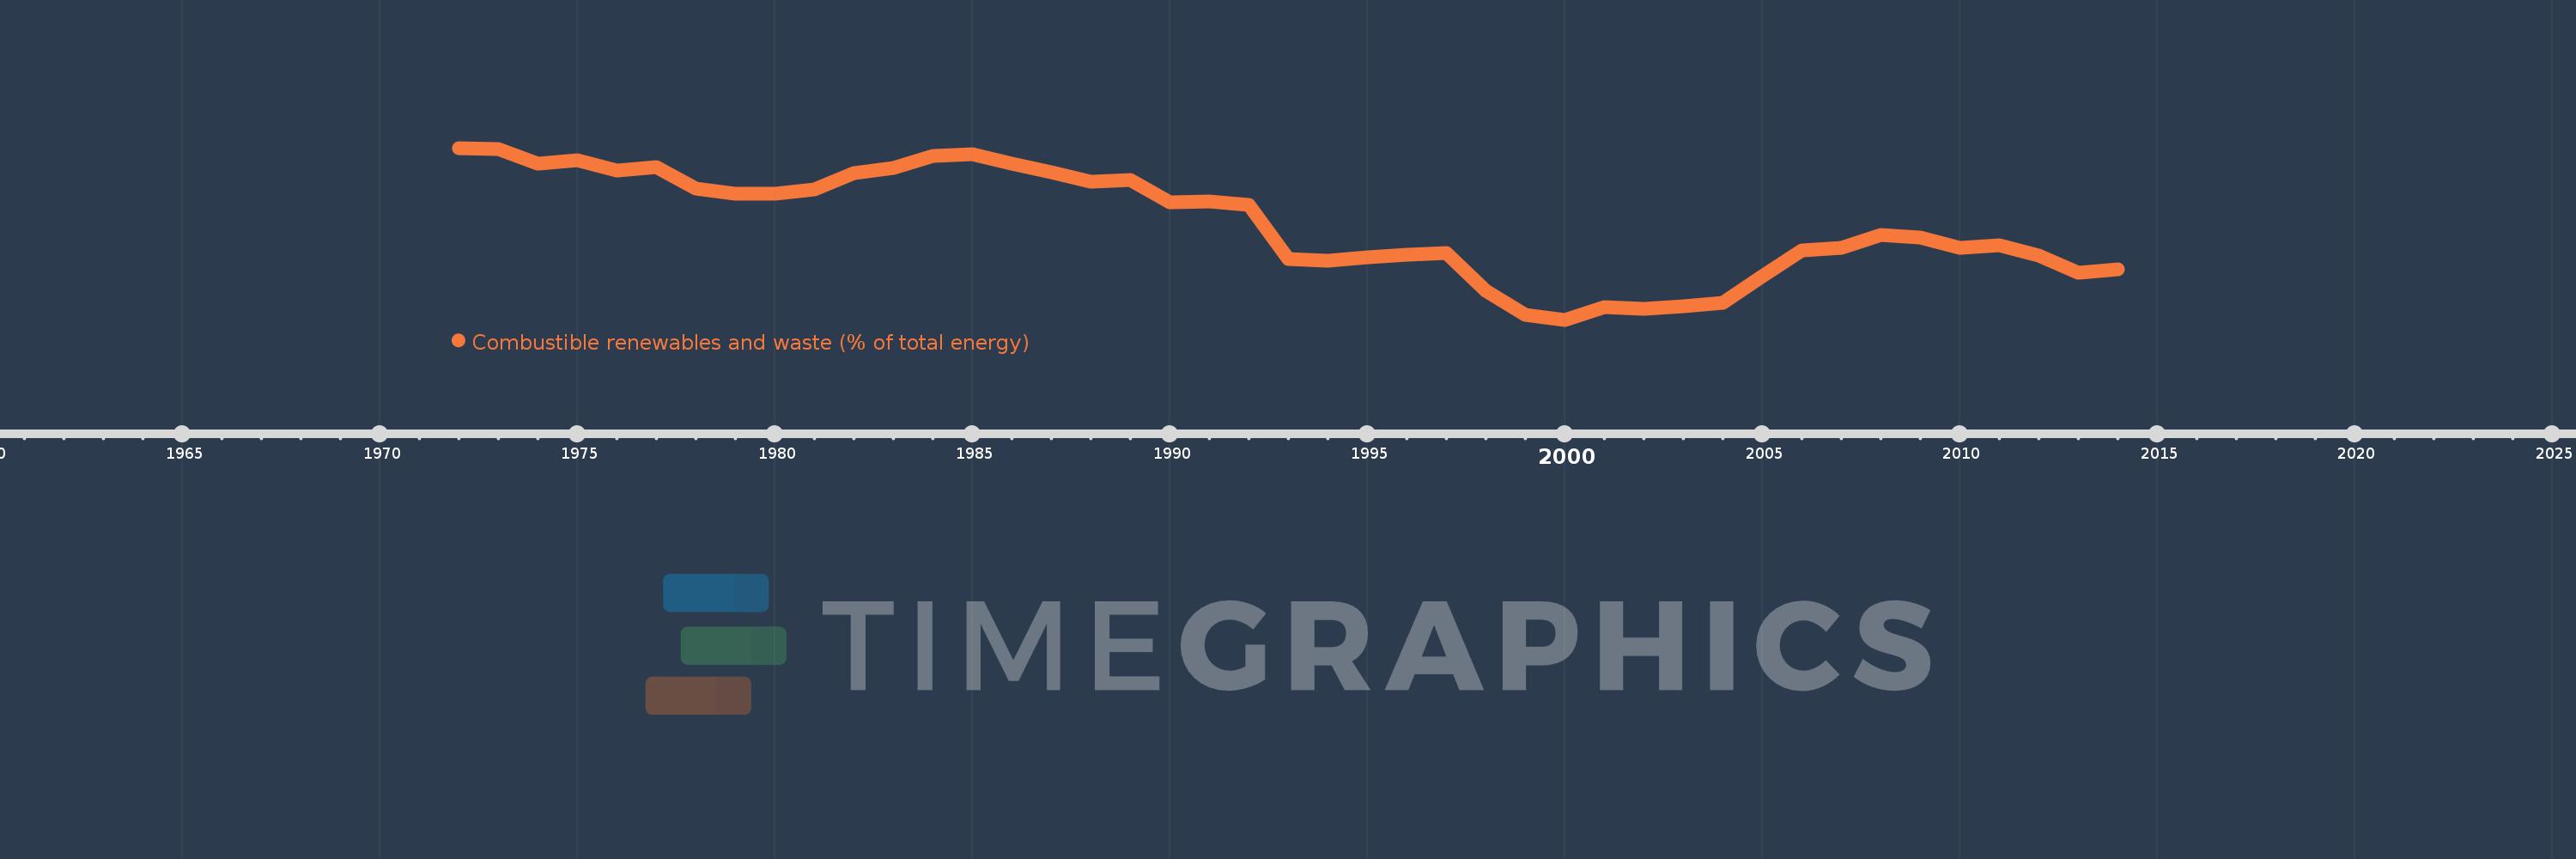
Combustible renewables and waste (% of total energy)
2014,2013,2012,2011,2010,2009,2008,2007,2006,2005,2004,2003,2002,2001,2000,1999,1998,1997,1996,1995,1994,1993,1992,1991,1990,1989,1988,1987,1986,1985,1984,1983,1982,1981,1980,1979,1978,1977,1976,1975,1974,1973,1972
Cette statistique dans les autres pays:
AlbaniaAlgeriaAngolaArab WorldArgentinaArmeniaAustraliaAustriaAzerbaijanBahrainBangladeshBelarusBelgiumBeninBoliviaBosnia and HerzegovinaBotswanaBrazilBrunei DarussalamBulgariaCambodiaCameroonCanadaCaribbean small statesCentral Europe and the BalticsChileChinaColombiaCongo, Dem. Rep.Congo, Rep.Costa RicaCote d'IvoireCroatiaCubaCuracaoCyprusCzech RepublicDenmarkDominican RepublicEarly-demographic dividendEast Asia & PacificEast Asia & Pacific (excluding high income)East Asia & Pacific (IDA & IBRD countries)EcuadorEgypt, Arab Rep.El SalvadorEritreaEstoniaEthiopiaEuro areaEurope & Central AsiaEurope & Central Asia (excluding high income)Europe & Central Asia (IDA & IBRD countries)European UnionFinlandFragile and conflict affected situationsFranceGabonGeorgiaGermanyGhanaGibraltarGreeceGuatemalaHaitiHeavily indebted poor countries (HIPC)High incomeHondurasHong Kong SAR, ChinaHungaryIBRD onlyIcelandIDA & IBRD totalIDA blendIDA onlyIDA totalIndiaIndonesiaIran, Islamic Rep.IraqIrelandIsraelItalyJamaicaJapanJordanKazakhstanKenyaKorea, Dem. People’s Rep.Korea, Rep.KosovoKuwaitKyrgyz RepublicLate-demographic dividendLatin America & Caribbean Latin America & Caribbean (excluding high income)Latin America & the Caribbean (IDA & IBRD countries)LatviaLeast developed countries: UN classificationLebanonLibyaLithuaniaLow & middle incomeLow incomeLower middle incomeLuxembourgMacedonia, FYRMalaysiaMaltaMauritiusMexicoMiddle East & North AfricaMiddle East & North Africa (excluding high income)Middle East & North Africa (IDA & IBRD countries)Middle incomeMoldovaMongoliaMontenegroMoroccoMozambiqueMyanmarNamibiaNepalNetherlandsNew ZealandNicaraguaNigerNigeriaNorth AmericaNorwayOECD membersOmanOther small statesPakistanPanamaParaguayPeruPhilippinesPolandPortugalPost-demographic dividendPre-demographic dividendQatarRomaniaRussian FederationSaudi ArabiaSenegalSerbiaSingaporeSlovak RepublicSloveniaSmall statesSouth AfricaSouth AsiaSouth Asia (IDA & IBRD)South SudanSpainSri LankaSub-Saharan Africa Sub-Saharan Africa (excluding high income)Sub-Saharan Africa (IDA & IBRD countries)SudanSwedenSwitzerlandSyrian Arab RepublicTajikistanTanzaniaThailandTogoTrinidad and TobagoTunisiaTurkeyTurkmenistanUkraineUnited Arab EmiratesUnited KingdomUnited StatesUpper middle incomeUruguayUzbekistanVenezuela, RBVietnamWorldYemen, Rep.ZambiaZimbabwe La ligne de temps
Cette échelle de temps montre un graphique de 1972 année à 2014 année Costa Rica. Les données jusqu'à 1971 année ne sont pas présentés. Quantité d'observations actuelles selon dates: 43.
Source (désignation):
Les indicateurs du développement mondiale
Source (organisation):
IEA Statistics © OECD/IEA 2014 (http://www.iea.org/stats/index.asp), subject to https://www.iea.org/t&c/termsandconditions/
Catégories:
Energy & Mining
Dernière mise à jour
23 avr. 2017
Les indicateurs de changement de valeurs selon les années
Minimum:
6.888
1 janv. 2000
Maximum:
30.68
1 janv. 1972
Pour la date d''observation
Valeur
Changement absolu
Le changement par rapport à la valeur précédente
1 janv. 1972
30.68
+30.68
0.0%
1 janv. 1973
30.515
-0.166
-0.54%
1 janv. 1974
28.523
-1.992
-6.53%
1 janv. 1975
28.954
+0.431
1.51%
1 janv. 1976
27.544
-1.409
-4.87%
1 janv. 1977
27.985
+0.441
1.6%
1 janv. 1978
25.094
-2.892
-10.33%
1 janv. 1979
24.286
-0.808
-3.22%
1 janv. 1980
24.292
+0.007
0.03%
1 janv. 1981
24.912
+0.62
2.55%
1 janv. 1982
27.14
+2.228
8.94%
1 janv. 1983
27.907
+0.767
2.83%
1 janv. 1984
29.52
+1.614
5.78%
1 janv. 1985
29.785
+0.265
0.9%
1 janv. 1986
28.512
-1.273
-4.28%
1 janv. 1987
27.365
-1.146
-4.02%
1 janv. 1988
25.985
-1.381
-5.05%
1 janv. 1989
26.215
+0.23
0.89%
1 janv. 1990
23.095
-3.12
-11.9%
1 janv. 1991
23.327
+0.232
1.01%
1 janv. 1992
22.848
-0.479
-2.05%
1 janv. 1993
15.263
-7.585
-33.2%
1 janv. 1994
15.059
-0.204
-1.34%
1 janv. 1995
15.547
+0.488
3.24%
1 janv. 1996
15.896
+0.349
2.24%
1 janv. 1997
16.09
+0.194
1.22%
1 janv. 1998
10.936
-5.154
-32.03%
1 janv. 1999
7.573
-3.363
-30.75%
1 janv. 2000
6.888
-0.685
-9.04%
1 janv. 2001
8.63
+1.742
25.28%
1 janv. 2002
8.383
-0.247
-2.87%
1 janv. 2003
8.737
+0.354
4.23%
1 janv. 2004
9.186
+0.449
5.14%
1 janv. 2005
12.914
+3.729
40.59%
1 janv. 2006
16.53
+3.616
28.0%
1 janv. 2007
16.872
+0.342
2.07%
1 janv. 2008
18.593
+1.721
10.2%
1 janv. 2009
18.292
-0.301
-1.62%
1 janv. 2010
16.798
-1.495
-8.17%
1 janv. 2011
17.251
+0.454
2.7%
1 janv. 2012
15.772
-1.479
-8.57%
1 janv. 2013
13.44
-2.333
-14.79%
1 janv. 2014
13.927
+0.487
3.63%
Classement des pays selon les statistiques actuelles par années


Commentaires: